Value Prop Testing and Kano Survey on Semantic Layer Technology
High Level Project Facts:
Research Goals:
Phase 1: Evaluate and improve value propositions for data provider (data engineers) and data consumer users (BI analysts).
Phase 2: Understand which Semantic Automation Layer features are most important to business analyst and data engineer end users
My Role: Lead researcher
Research Methods: Value proposition testing, Kano model survey
(Phase 1)
Background:
IBM Research creates the latest advances in computing and software at IBM. Their teams typically include scientists, engineers, and designers but user researchers are less commonly assigned to their projects. A team at IBM was working on advances in semantic automation layer technology.
Put simply, a semantic automation layer is a piece of enterprise data architecture that helps business users access the data they need by connecting data into meaningful business terms. IBM.com notes “ Without a semantic layer, an analyst who wants to create a report must understand the database schema, develop SQL queries to extract the necessary data from the various tables, transform, export and visualize the data; it's a time-consuming and complicated process.” (source)
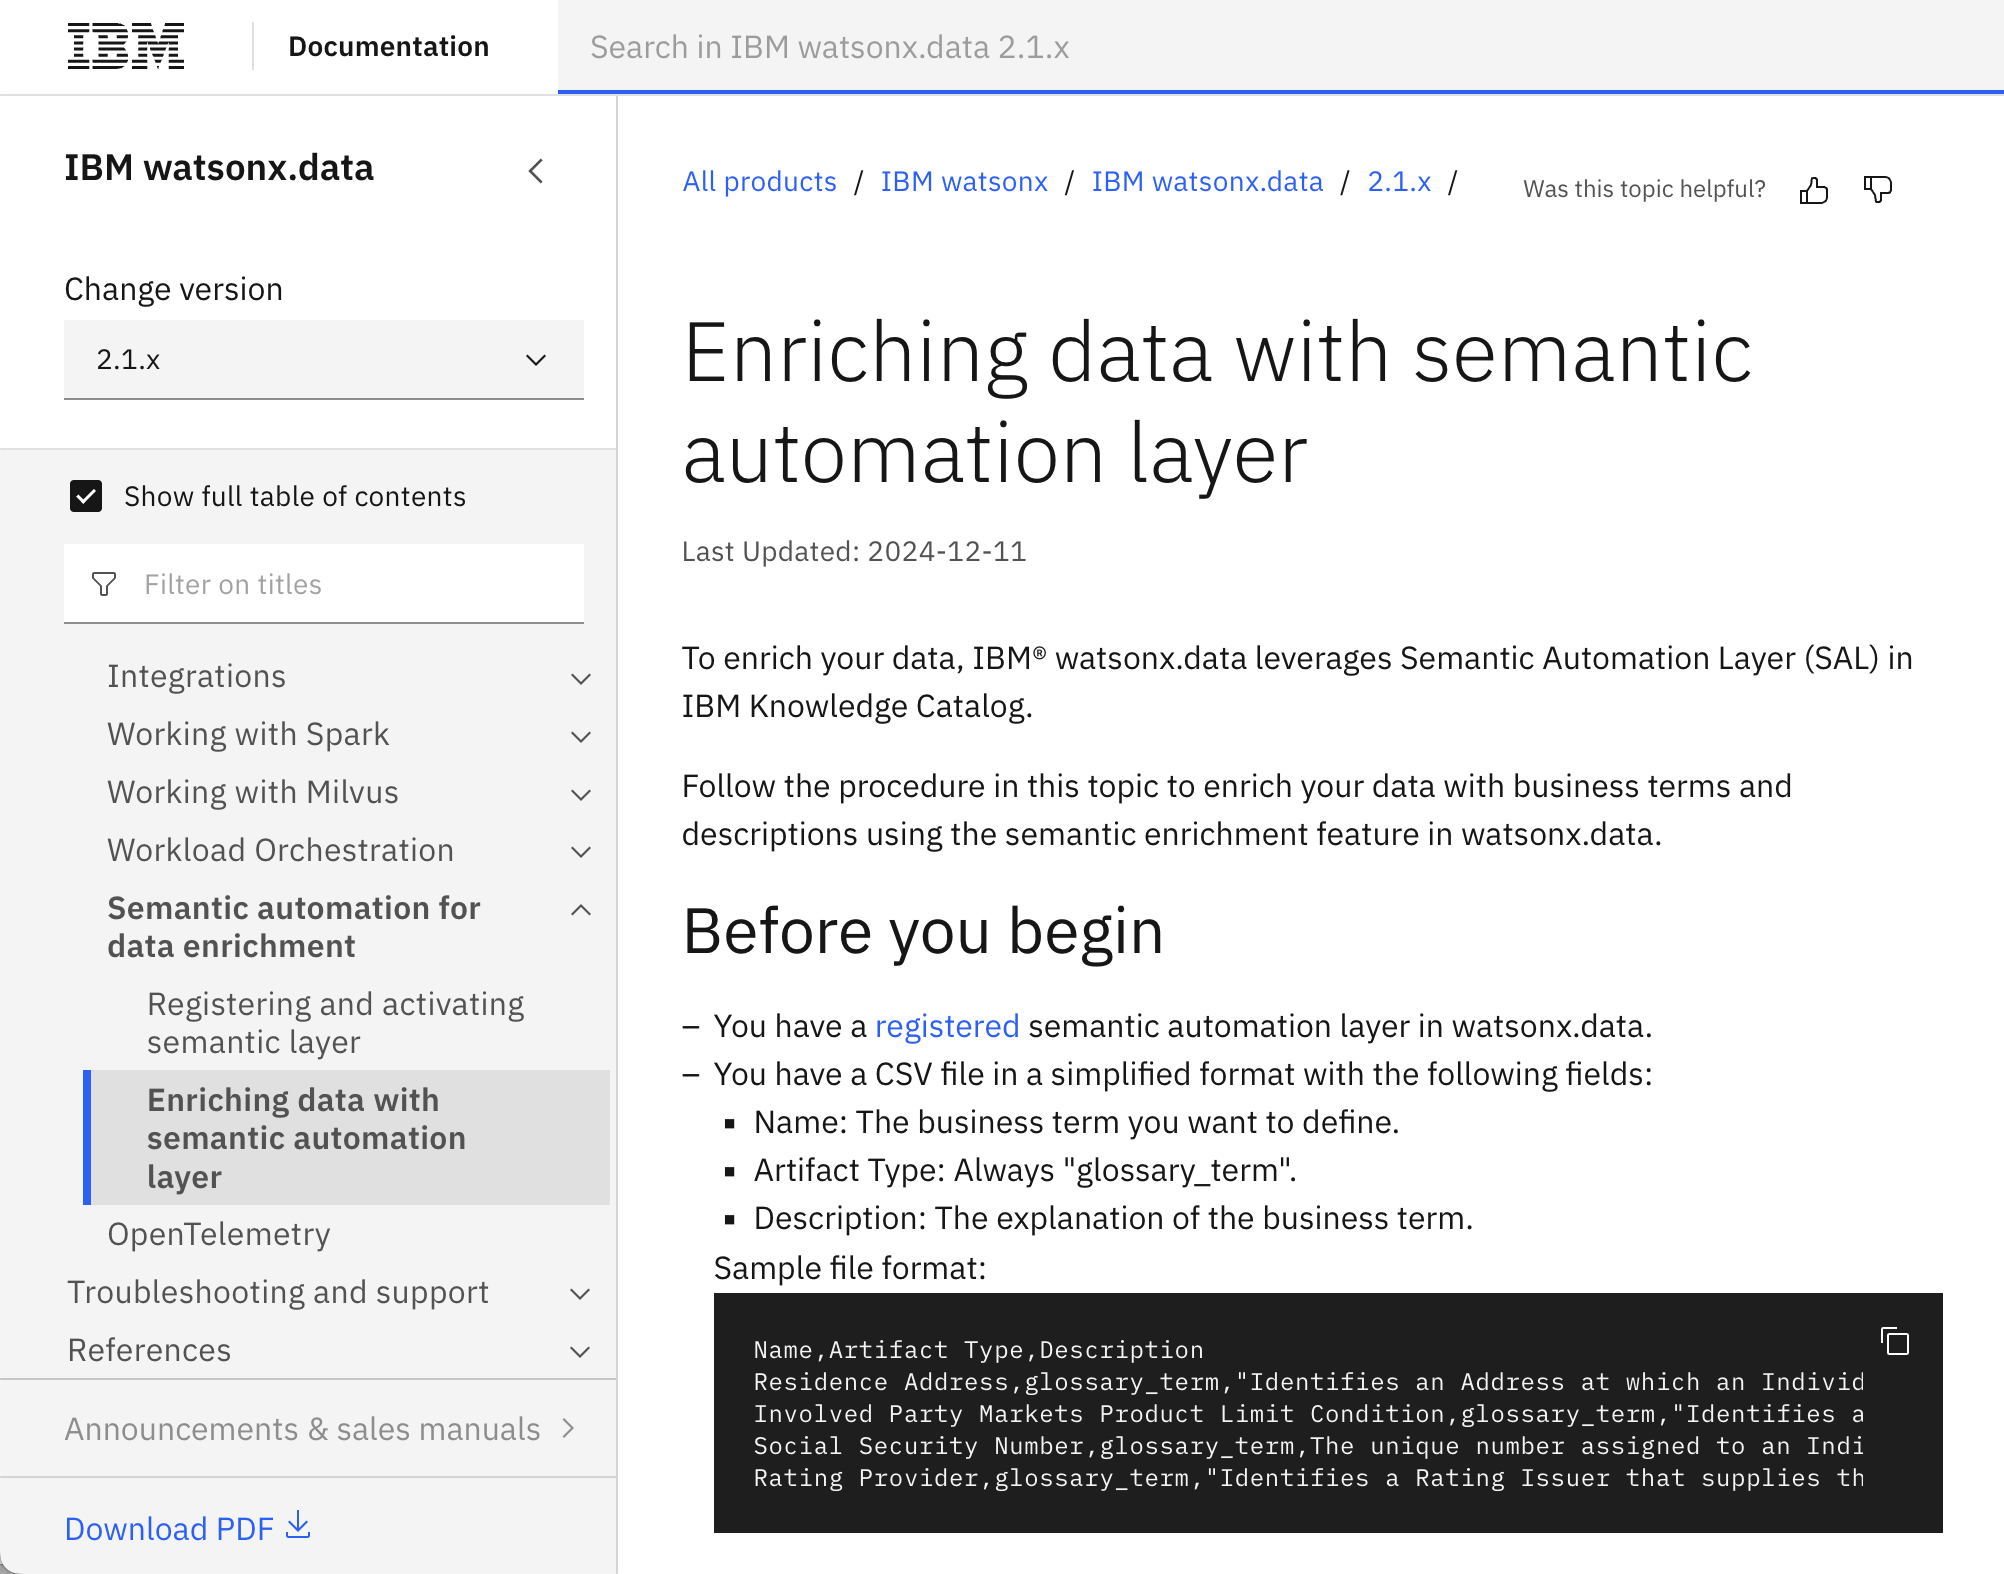
IBM documentation website explaining one of the downstream applications of a semantic automation layer.
The problem:
A team working on semantic automation layer models felt confident in their technology but unsure of the best way to position its value and application to maximize customer interest. The Director of IBM Research Cambridge reached out to VP of Design for IBM Data and AI with this problem. I was nominated to lend user research outcomes to this project due to my experience with Data and AI software and my seniority.
I joined the IBM Research team, ramping up on understanding the software solution along with the hypothesized true business need at hand. There wasn’t a working prototype of the solution at this stage but the team needed to make sure the solution would be of interest and solving a business problem for future users.
The team had formed value propositions that were being used to communicate the project and its intended outcomes to executives and stakeholders at IBM. We chose to evaluate these statements in order to ensure alignment around a user-tested outcomes.
Goal:
Evaluate and improve value propositions for data provider (data engineers) and data consumer users (data scientists and BI analysts)
Research questions:
Is the potential value of this solution understood by potential end users?
Do our value proposition statements address true pain points end users need?
What are things that make end users skeptical about this solution?
How much of an impact do users foresee this having on their day to day functions?
Method and Process:
Taking into consideration:
the goals and questions spurring this research
what was available to test
timeline when answers were needed
I proposed Unmoderated Value Prop Testing as our main method. I worked with the team to create a dummy IBM website homepage that featured the value proposition of the software along with a visual aide. I chose an unmoderated approach to limit the effect of observer bias on participants responses to this new product and to simulate how potential users will naturally encounter the solution online.
During the 30 minute session, participants were presented with the “website” and were asked to describe and rate their understanding. Some questions asked included:
In your own words, describe this offer.
Who is this offer meant for?
What value could this provide you, if any?
What, if any, concerns do you have about the offer?
How would having this offer impact your work as a [data scientist/ data engineer/ BI analyst]
In addition to qualitative responses to the questions above, participants were also asked to rate statements along a Likert scale. Statements included
“This offer is easy to understand” (1 - strongly disagree, 5- strongly agree)
“This offer is exciting to me” (1 - strongly disagree, 5- strongly agree)
“This offer compels me to take action” (1 - strongly disagree, 5- strongly agree)
“Having these capabilities would save me time” (1 - strongly disagree, 5- strongly agree)
The quantitative measures above were added to provide context and validate insights gathered through qualitative responses. Subsequent “why?'“ questions were included to help answer the larger research questions this study aimed to find, essentially, do potential users believe this software will benefit them, and if not, how should the capabilities be positioned to address true pain points.
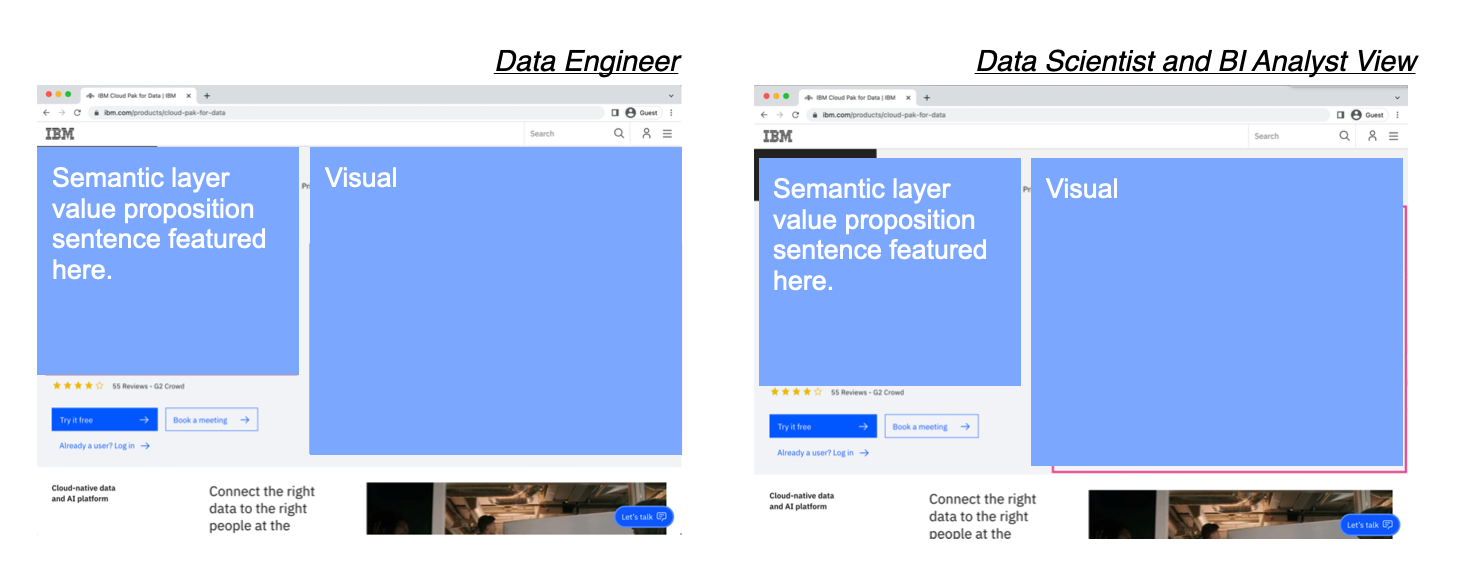
Each user group was presented with an IBM homepage featuring Semantic Layer value proposition and accompanying visuals
Participants:
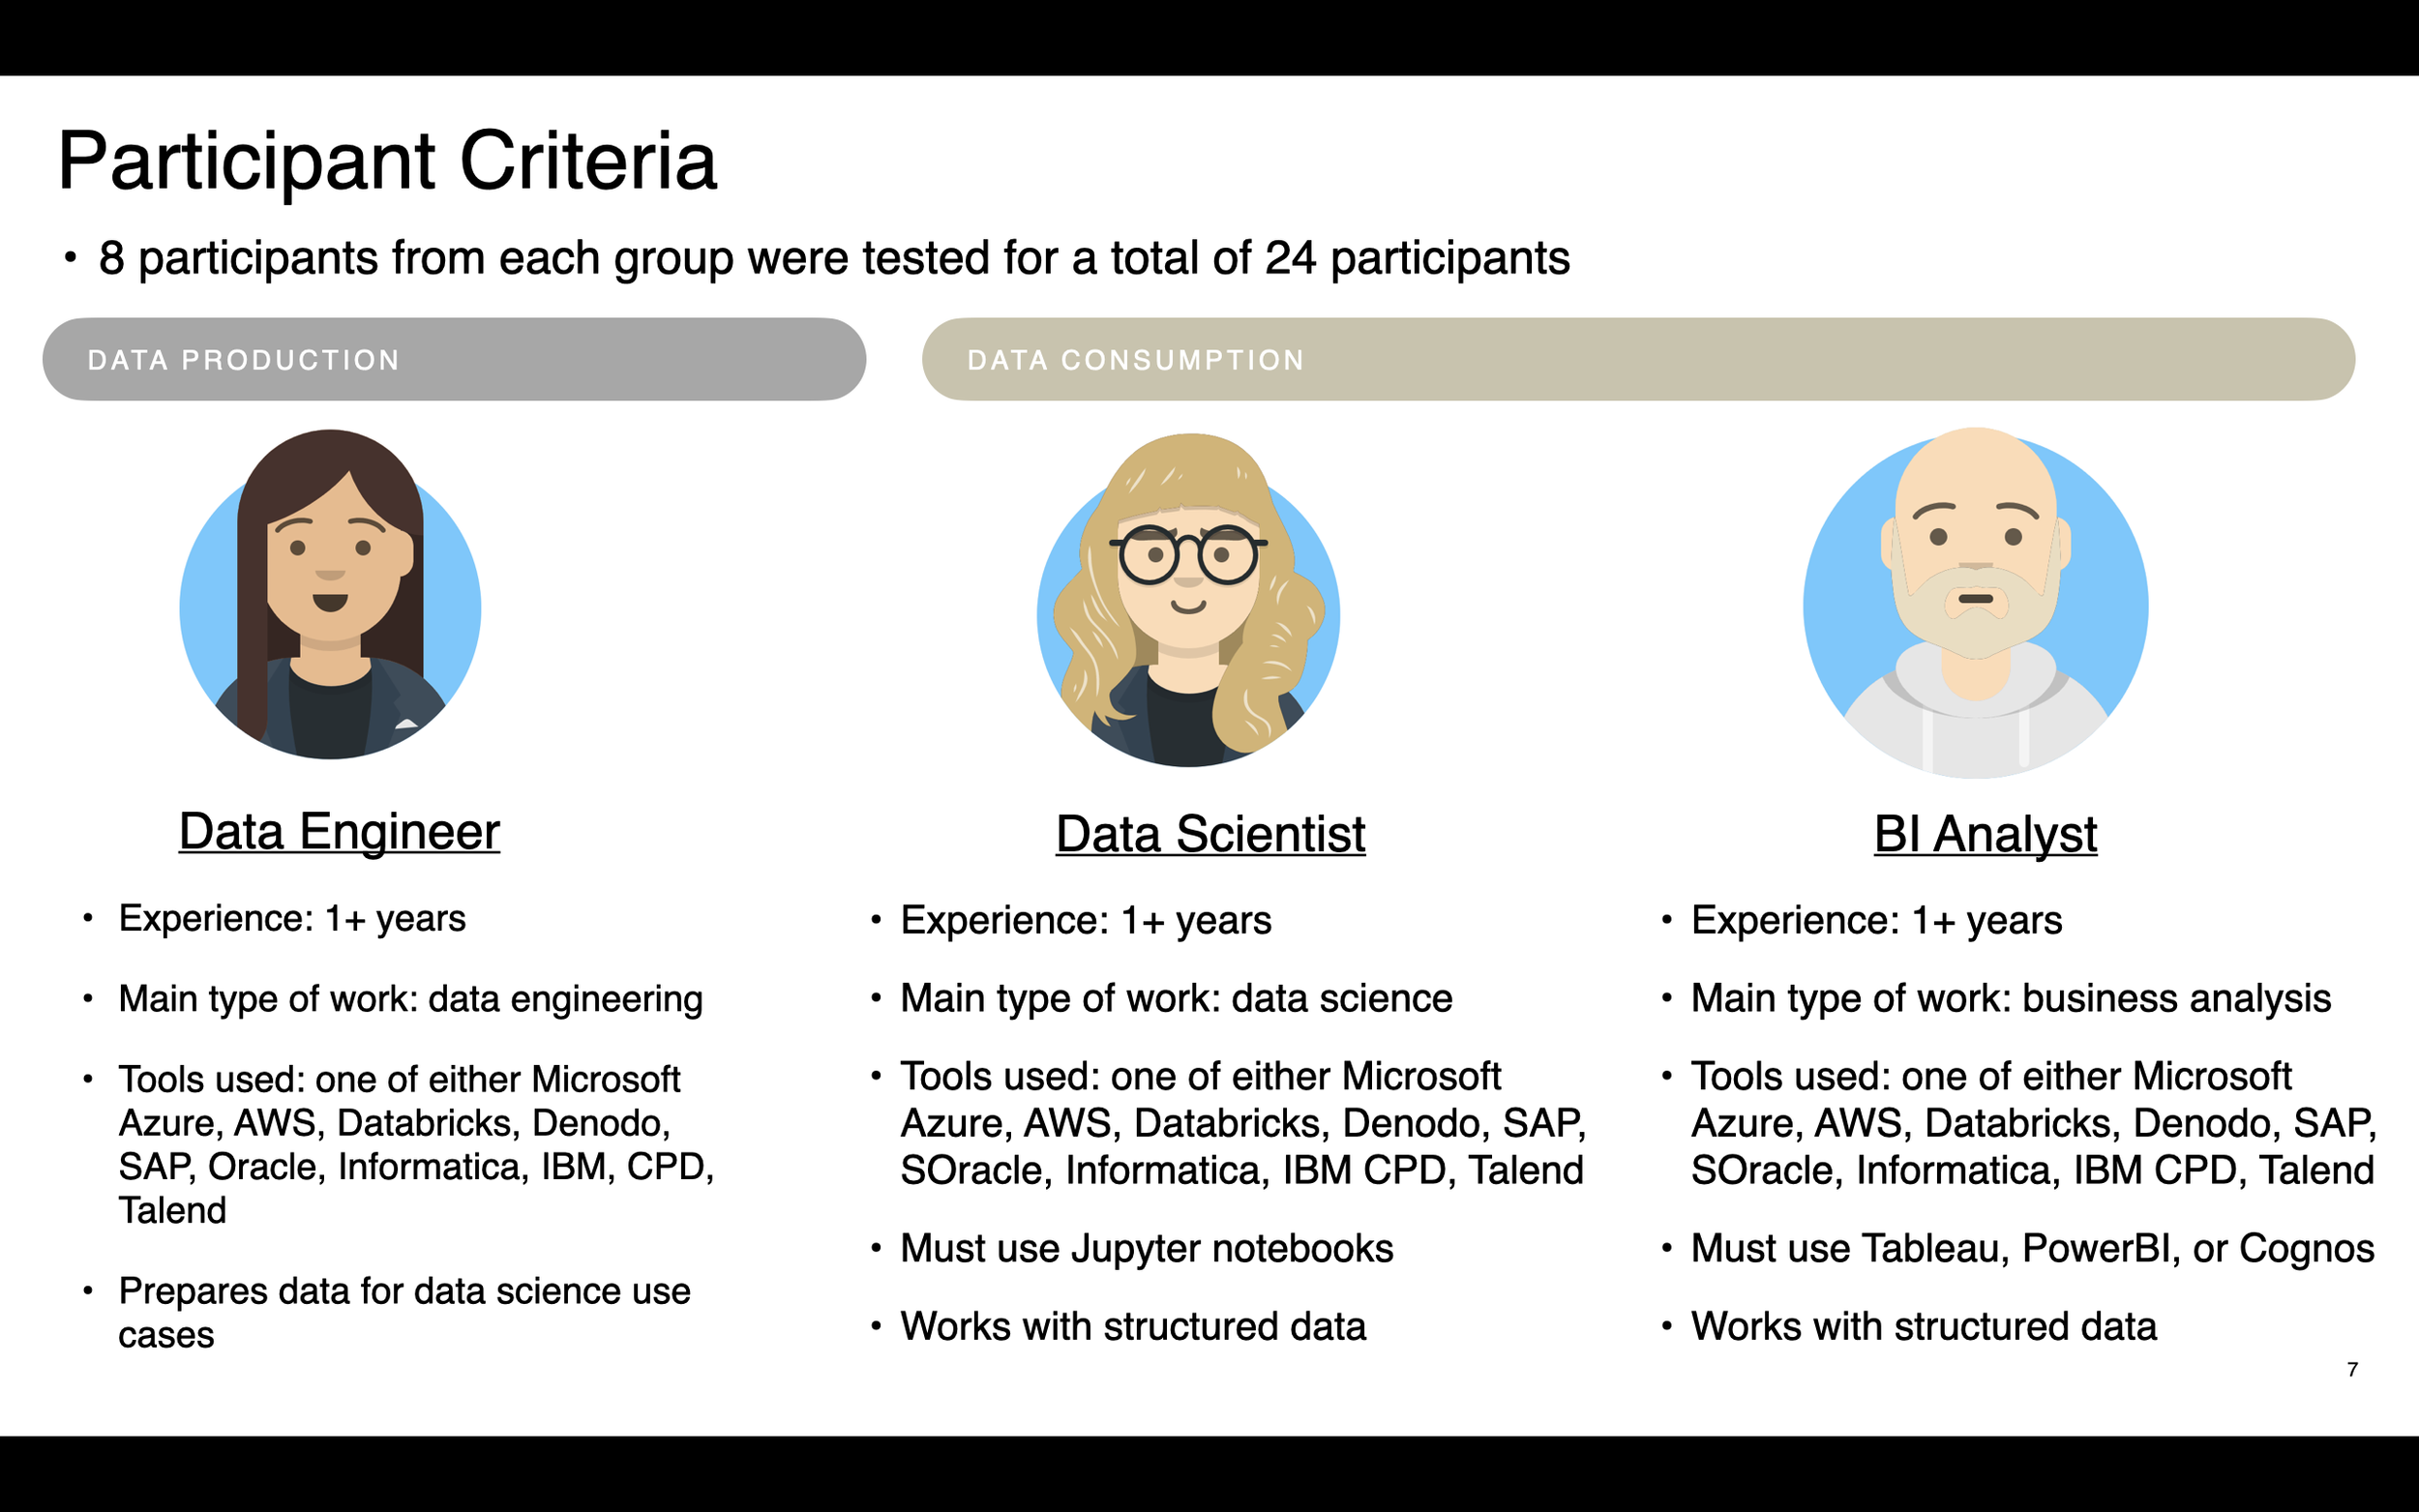
Participant criteria was gathered through discussions with the director of IBM Research along with internal subject matter experts
Using Respondent, a recruiting platform, I formed screeners for each of these participant groups.
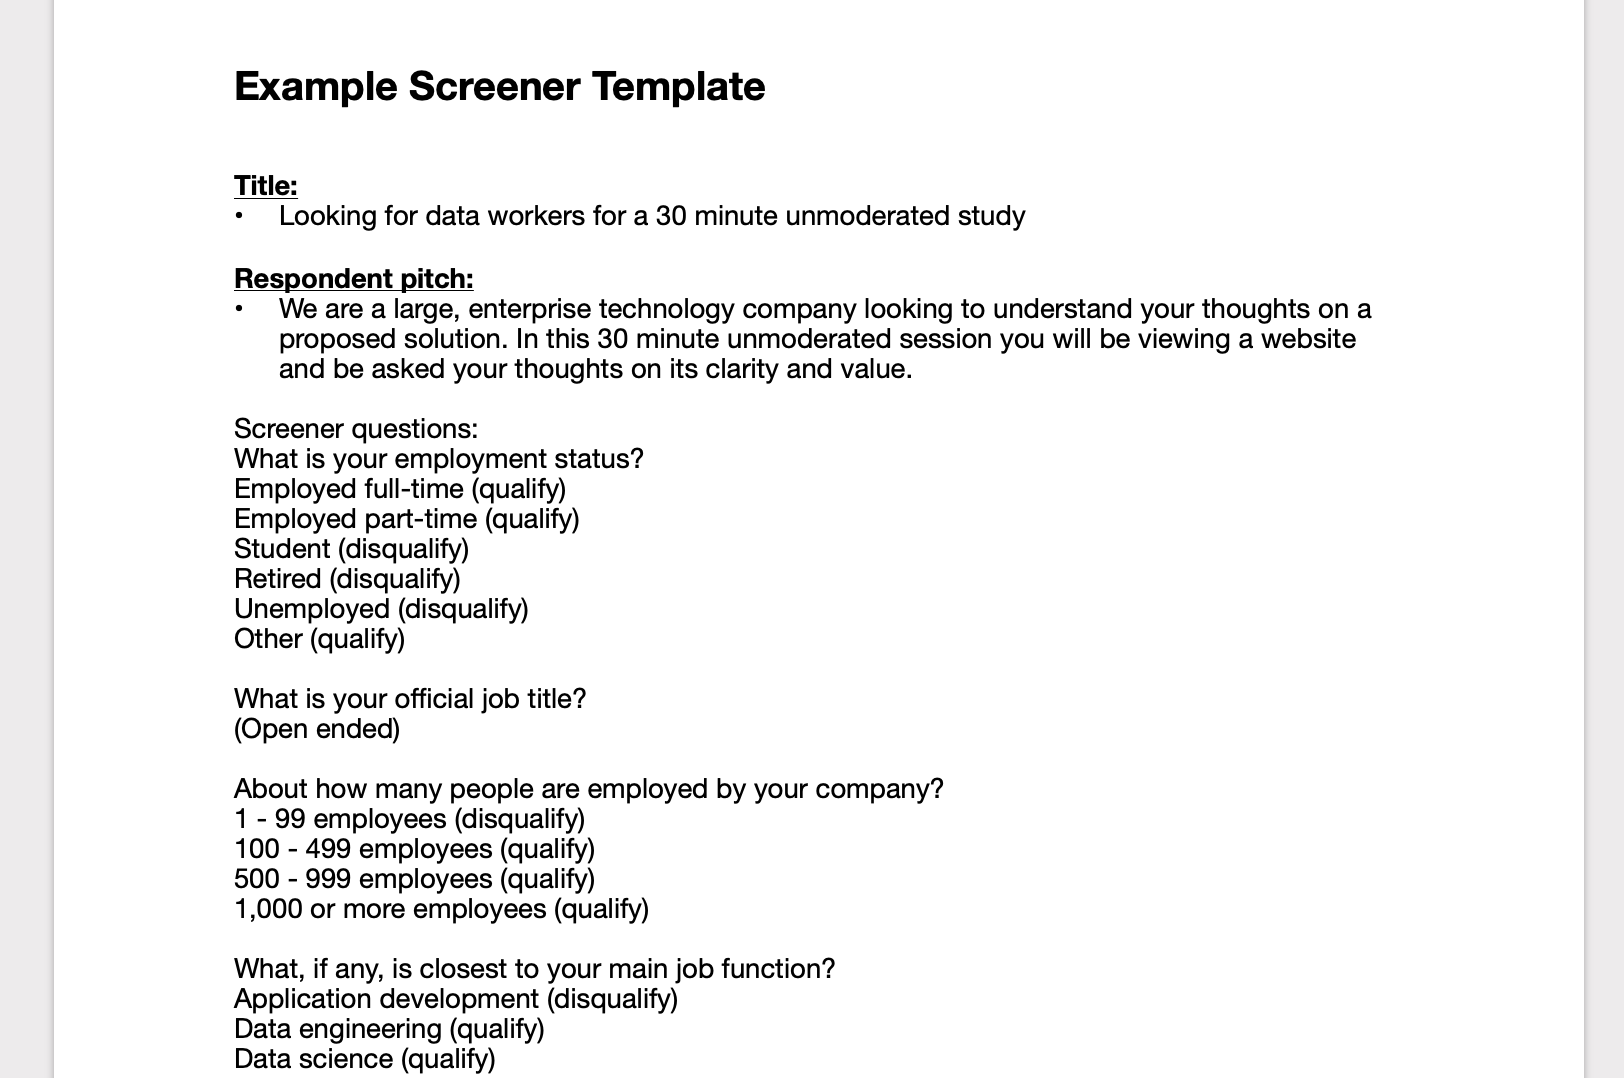
Example screener
Questions and testing materials were uploaded to UserTesting.com and was piloted by an internal data scientist in order to iron out any issues before launch.
Analysis and Results:
Quantitative and qualitative results were analyzed to help form a full picture of how well participants understood the value of the solution and how interested they were in it.
High level findings that were consistent across user groups included:
Understanding of the solution: All roles had a general understanding that this is an AI automated tool that assists business users that may have limited technical ability, but data engineers struggled to understand the level of manual intervention that would be needed by their part.
What excited participants: An exciting aspect of the proposition for all was the promise of being a time saver.
Areas of potential concern: All participant groups expressed concern over trustworthiness in the accuracy of the AI and the tool’s ability to perform with their specific data analytics use cases and domains.

Results slide
Similar slides were presented and created for other roles that answered:
What excited Data Engineers about this value proposition?
What concerns did Data Engineers have about this value proposition?

Rating scale results helped provide supporting data to qualitative responses. In order to communicate reliability and potential fluctuation, I made sure to visualize confidence intervals for the result, especially given our small sample.
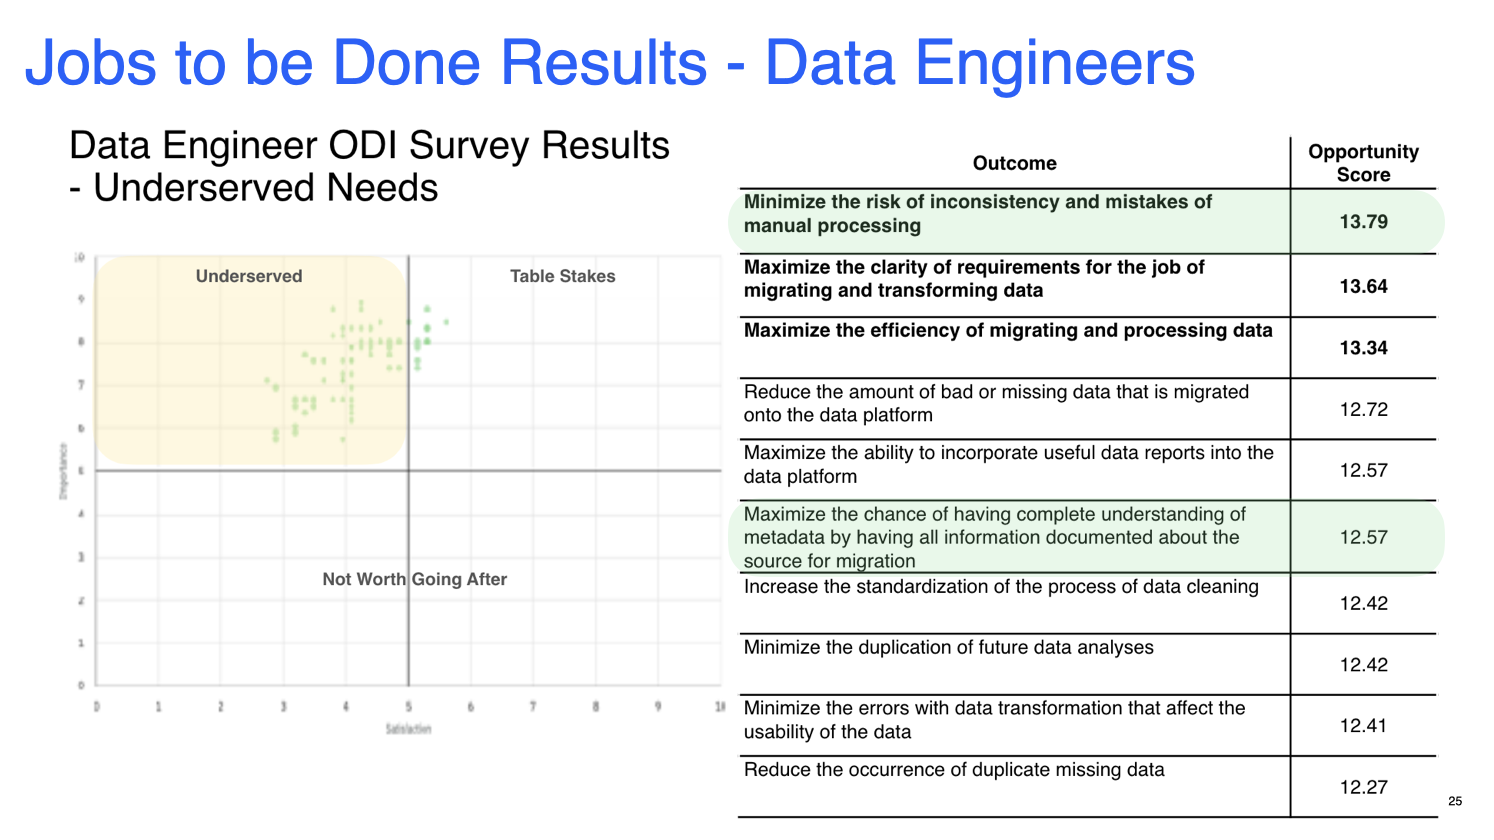
Triangulating from past studies
I brought in results from our recent Jobs to be Done study, as the biggest opportunity for data engineers was “Minimizing the risk of manual processing”. This overlapped with one of the main misconceptions data engineers had on the value proposition, indicating the necessity to clarify this point.
Of the rating results, data engineers were more likely to give a lower rating on ease of understanding of the value prop, than data scientists were.
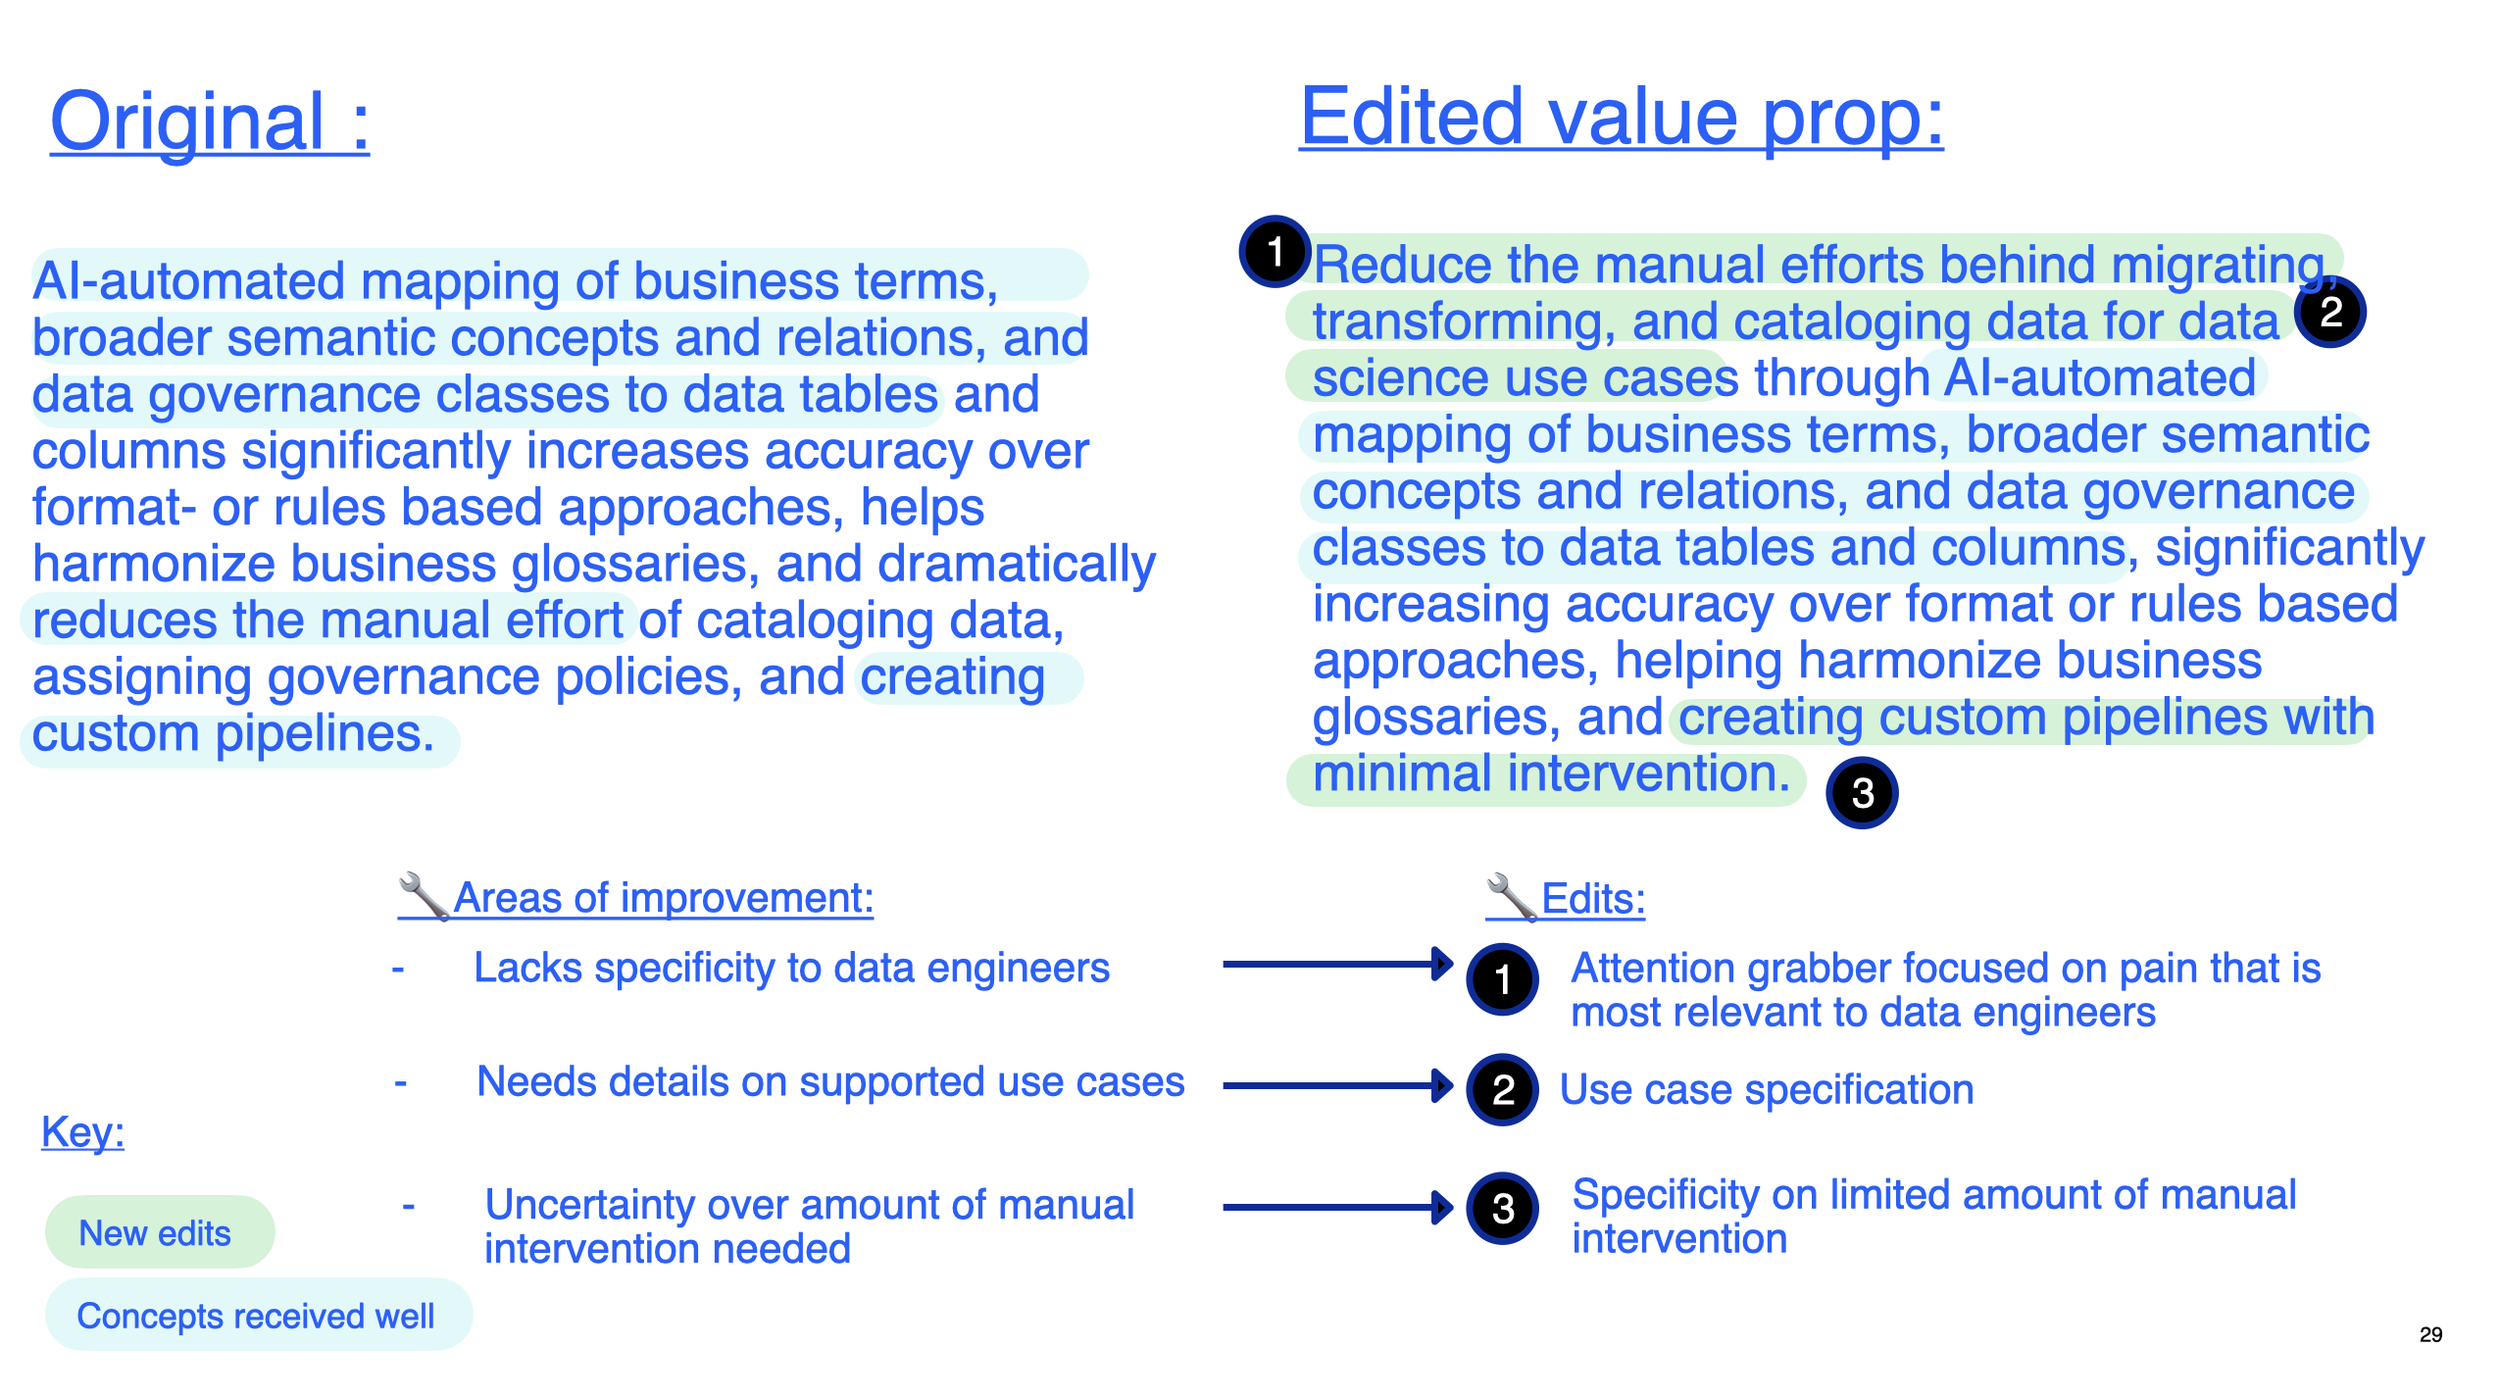
Qualitative responses showed that data engineers understood the offers high level intention but had a misconceptions over the amount of manual intervention that would be needed and who the offer was intended for - 4/8 engineers said this offer was meant for business users.
Taking into consideration these results along with other comments, a new value proposition was proposed to help appeal to data engineers:
Outcomes
The results of this research were used by the IBM Research team to sharpen their product pitch and ensure the solution was positioned to target true needs of data engineers and data consumers
(Phase 2)
Background
In Phase 1 of this project, the team needed to ensure the capabilities being developed were positioned in a way that serve real needs for users on the data production and data consumption ends of the data lifecycle. With this refined focus, and as the tool became more developed and its capabilities more defined, executive leadership nominated the product to be showcased during IBM’s annual THINK conference during a 30 minute demo on its Product Showcase stage. Given the limited time to drum up excitement for the capabilities, we needed to ensure we showcased the capabilities that appealed most to potential users.
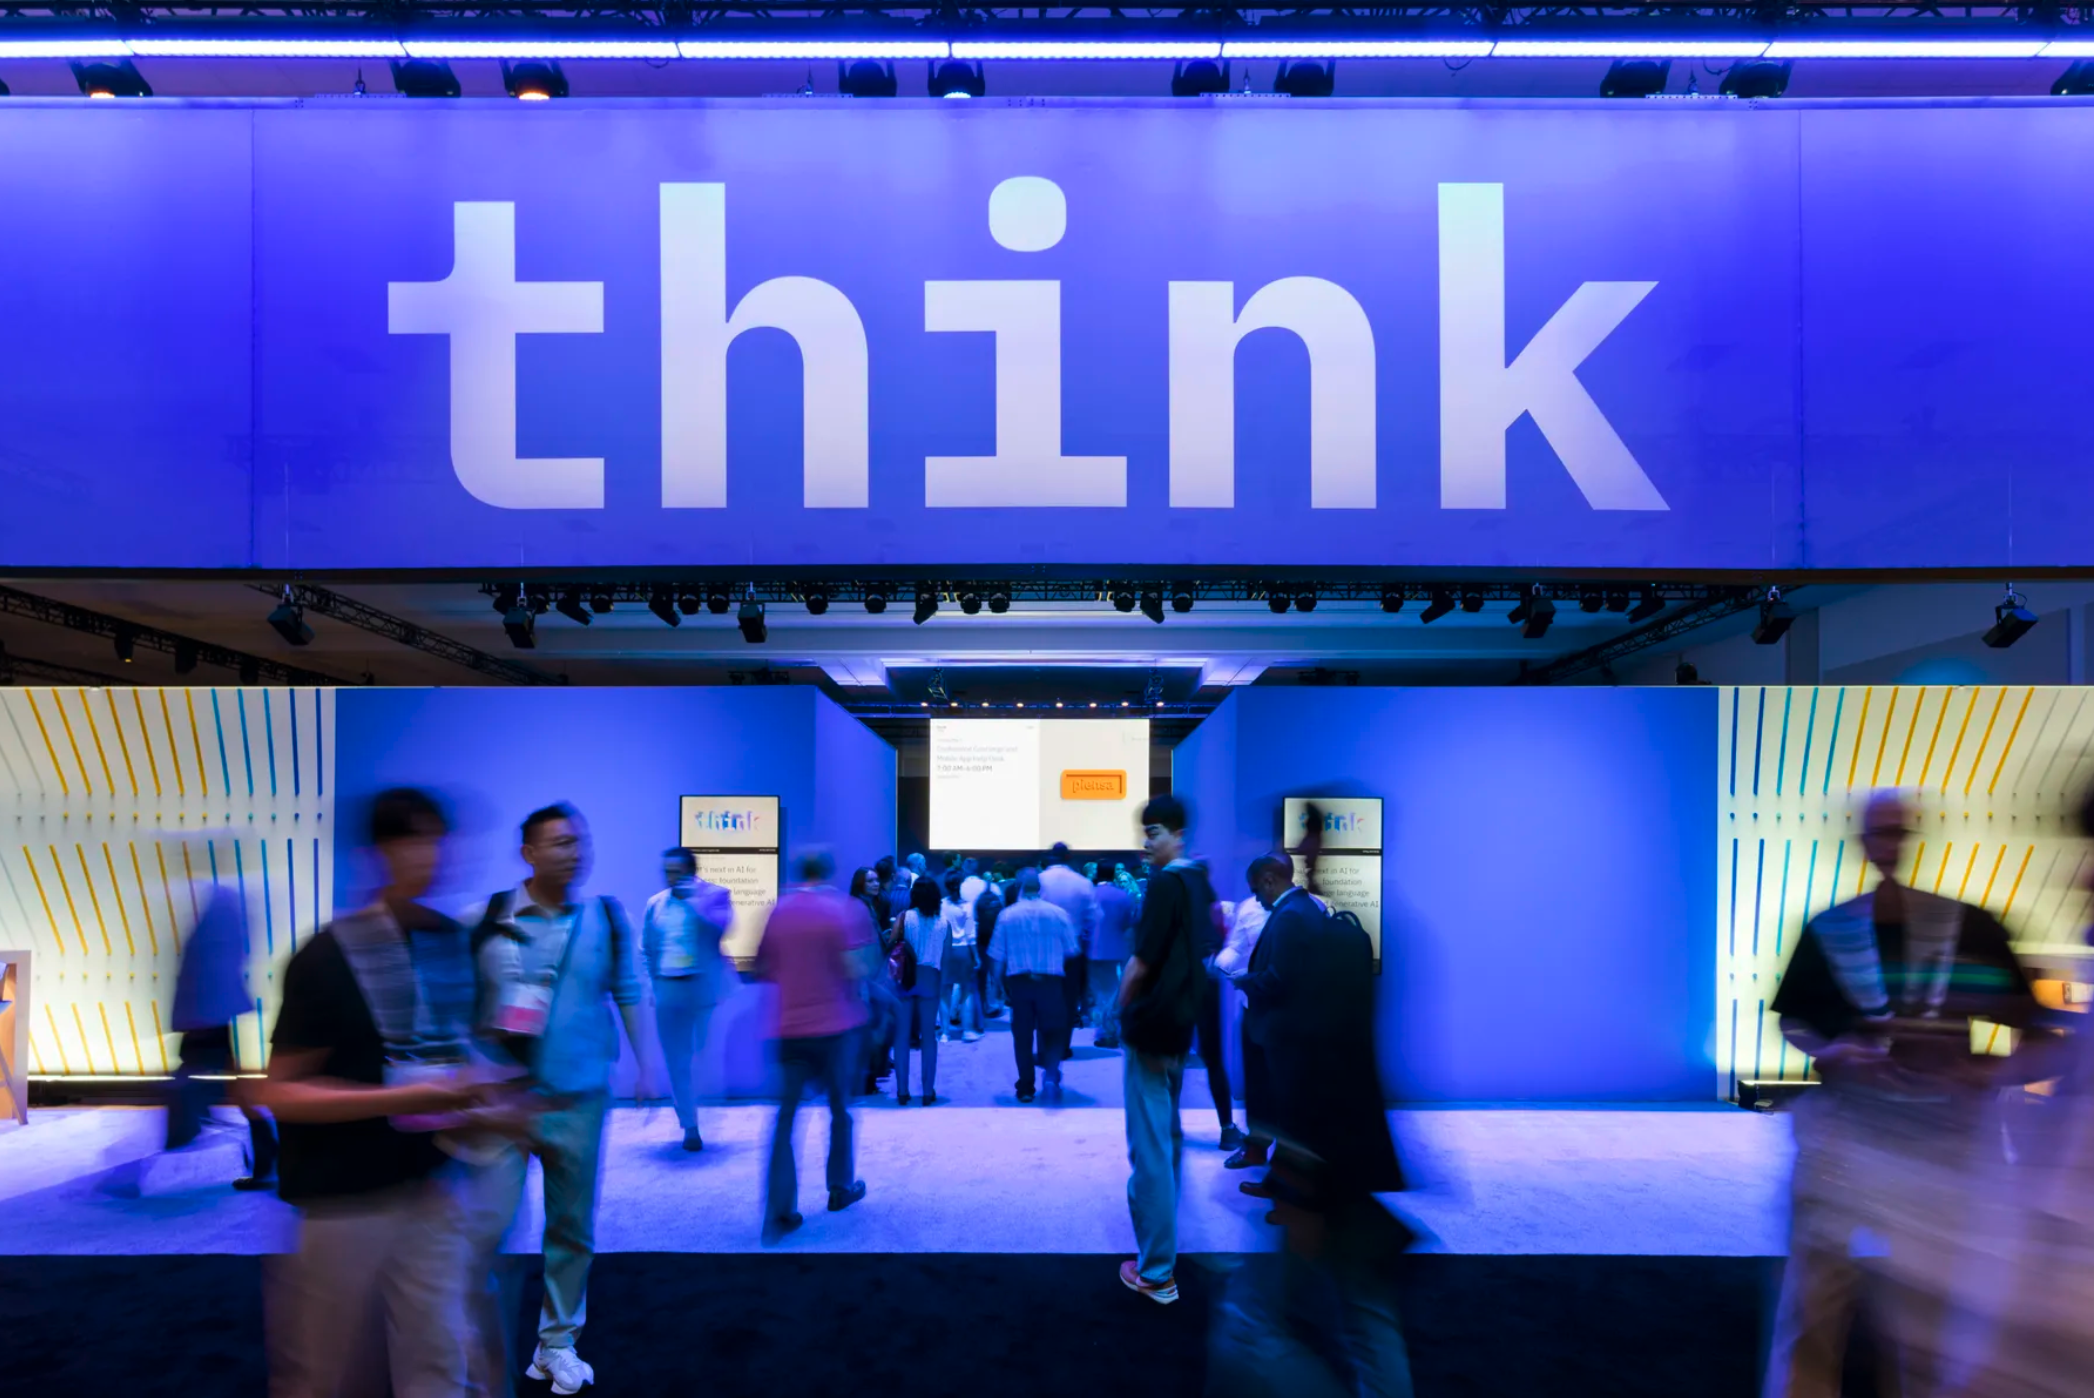
Courtesy of IBM
Goal:
Understand which Semantic Automation Layer features are most important to business analyst and data engineer end users.
Method and Process:
We ran a prioritization study with 40 participants across roles in data production side (such as data engineers) and data consumption (such as business analysts) including externally recruited proxy customers and internal IBMers fitting the target roles.
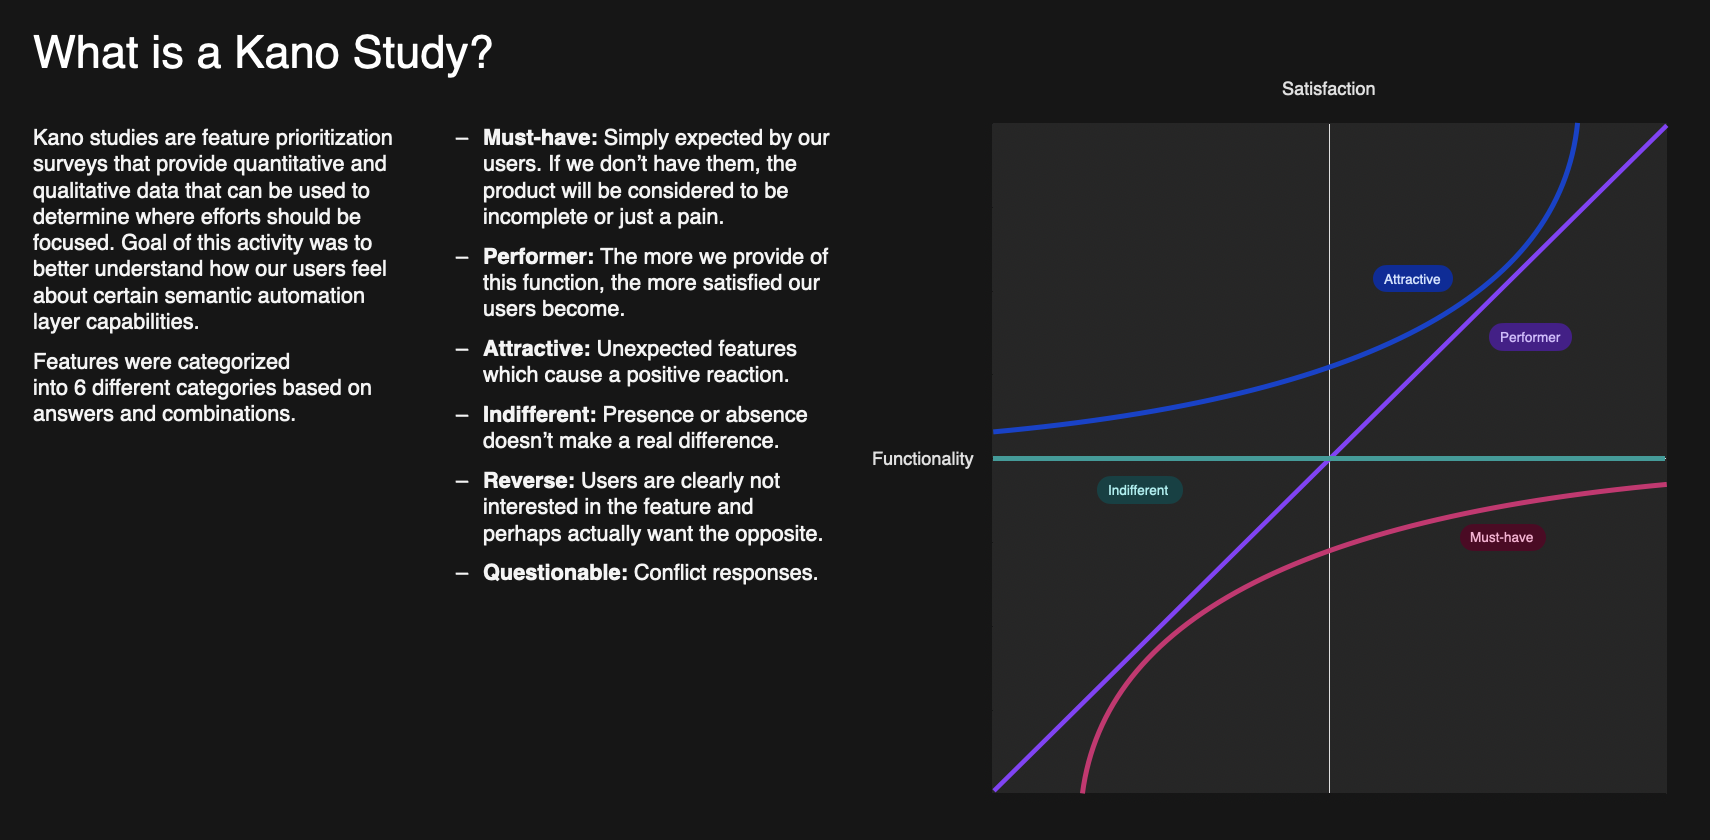
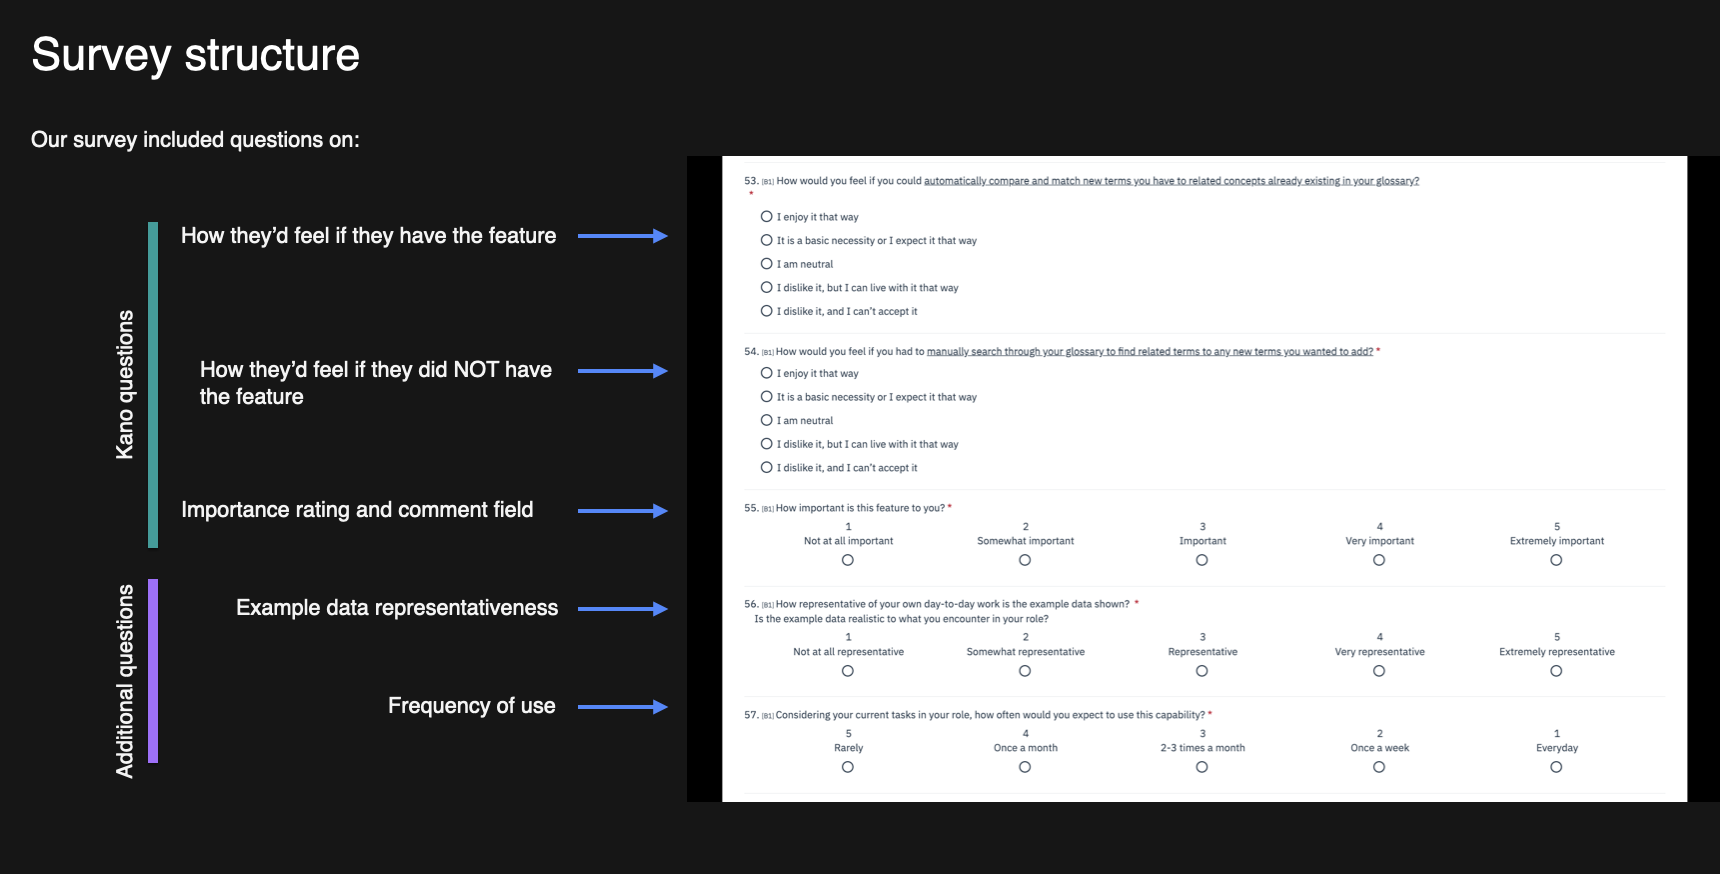
Given the need to prioritize a number of features, this study used a Kano Study survey, which is a prioritization survey that provides quantitative and qualitative data in order to determine where efforts should be focused. Survey Participants were asked how they would feel if they had this feature and how they would feel if they did not have the feature.
Slide stills from original final presentation
Slide stills from original final presentation
Over the course of multiple meetings, I worked with the IBM Research team to shortlist the features we would be testing for each user group and create short descriptions and images to accompany their entries in the survey.

In the survey itself, according to the typical Kano model, we asked them to rate how they’d feel if they had the feature, if they didn’t and how important they felt it was. In addition to these fundamental questions, the team also wanted to understand whether the data depicted in the example images was true to what potential users were encountering in their day-to-day, as well as how often they expected to use this capability.
Participants
As with phase 1 of this topic, in order to recruit participants that would match actual IBM customers, I formed criteria along role, role experience, company size, tasks, and tools used to ensure we had high quality participants that reflect actual end users.
Taking into consideration the time we had before the THINK conference along with the accuracy we needed, and the fact that we would not be comparing results between user groups, I determined that 20 participants per user group would be a sound target for this project (source).
Analysis and Results
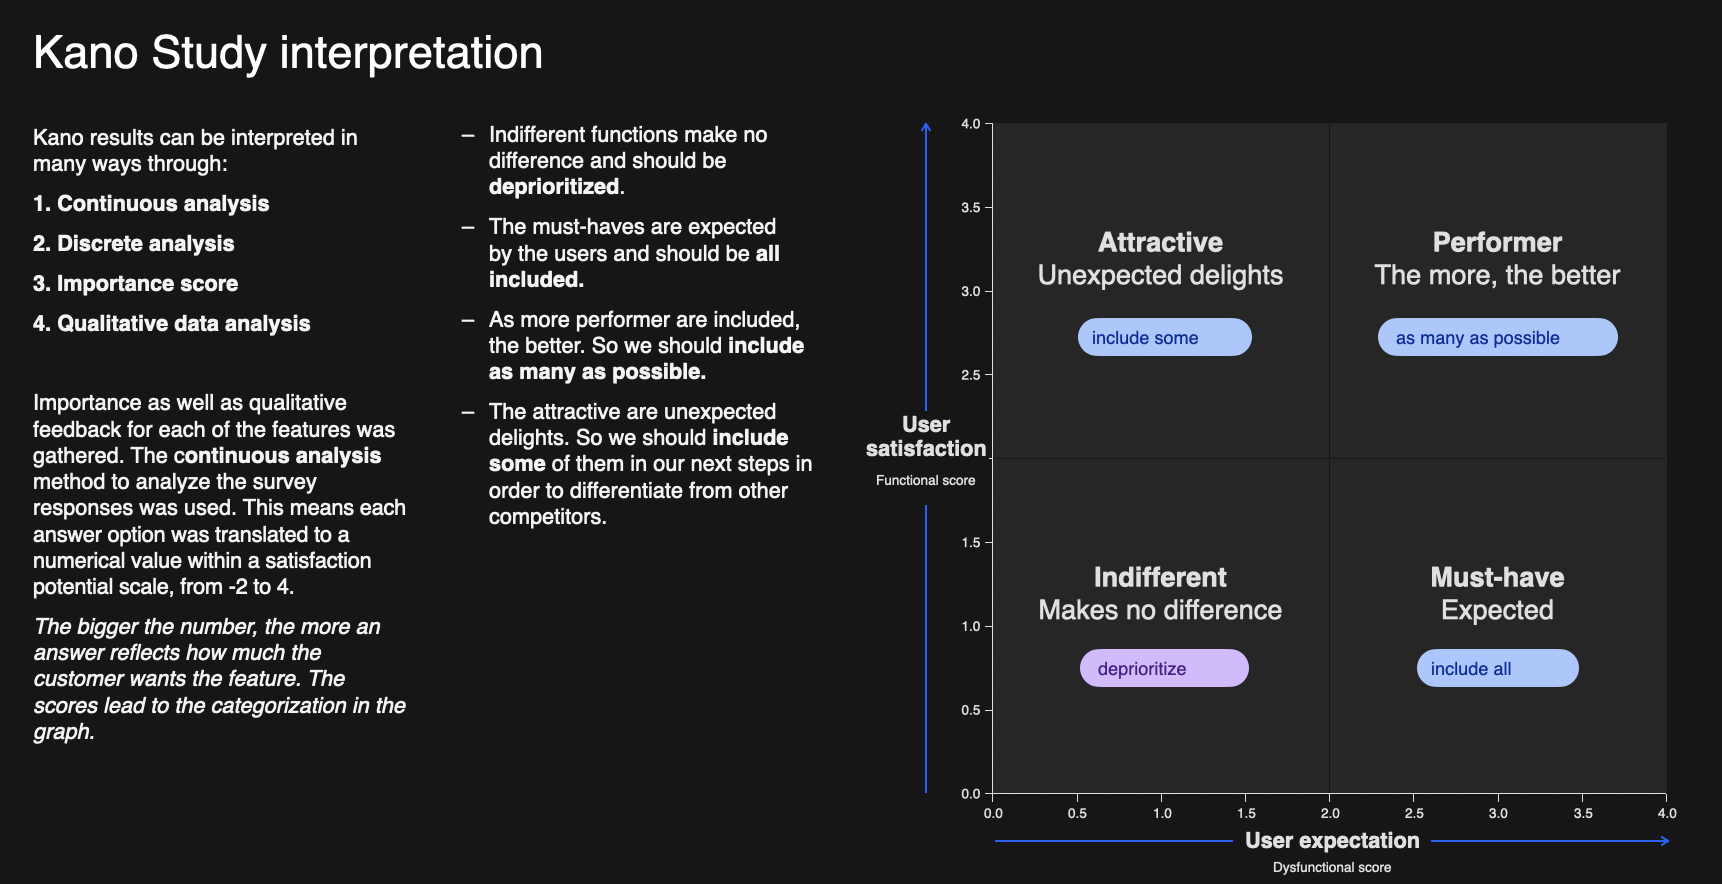
Data was analyzed using a continuous analysis and took the following steps:
Scoring each answer
Functional: -2 (Dislike), -1 (Live with), 0 (Neutral), 2 (Must-be), 4 (Enjoy);
Dysfunctional: -2 (Enjoy), -1 (Must be), 0 (Neutral), 2 (Live with), 4 (Dislike);
Importance: 1 (Not at all Important), …, 5 (Extremely Important.)
The average Functional, Dysfunctional and Importance values was calculated for all answers
The standard deviation for the Functional and Dysfunctional scores
Taking the averages and standard deviation of each feature, their score was plotted on the categorization plane seen below:

Results determined that all features evaluated by data engineers and business analysts were categorized as “Attractive”. While this may seem like a strange surprise, on considering the features we were testing - innovative solutions using state-of-the-art semantic layer technology, it comes as no surprise that these would be categorized as attractive, unexpected features.
Capabilities were mapped on the x-y axis according to their average and standard deviation.
Kano categorizations are not stagnant, but change over time. What once was an innovation or “attractive”, in a few years will be an expectation or a “must-be”. Using the iPhone as an example - the touchscreen interaction was novel compared to the Blackberries and other phones of the time, fast forward to now and you pretty much expect touchscreen interaction from your phone.
With all features validated as being attractive, further prioritization came from the importance scores and open ended responses.

Ratings for importance showed there was overlap between those top ranked features for data engineers and business analysts as seen below:

Outcomes
With this information on hand, the IBM Research team designed and developed a demo environment for the THINK 2023 conference. The Kano results helped them understand which features should have more demo time and be a larger focus of the demo. Subsequent research carried out by another researcher (as I was on FMLA leave) evaluated the user experience of these new features.
Semantic Layer capabilities were showcased on stage and received well by attendees.
Lastly, the team’s work on this project was published in the IUI '24: Proceedings of the 29th International Conference on Intelligent User Interfaces.

Reflections
The Kano method survey conducted in this study was chosen because of:
its ability to identify prioritize features based on user needs
the time we needed results in
Due to the innovative nature of the semantic automation layer field that we were testing, I speculate that that caused all features to be ultimately categorized as attractive. Had I had more time, in an ideal situation, I would have chosen to follow up the Kano survey with a MaxDiff survey. Because of the MaxDiff’s forced trade-off nature this would allow respondents to truly prioritize between the features available.