Interview and Seller Survey on Data Fabric Software Buying Experience
High Level Project Facts:
Research Goals:
Identify the customer expectations around Data Fabric
Understand the buying process and roles involved
Identify the challenges in selling a Data Fabric in order to help empower sellers to sell Data Fabric
My Role: User researcher on a team of 4 researchers (2 senior researchers and 2 user researchers). I, along with the other user researcher, were specifically responsible for study design planning, recruiting, execution, analysis and final presentation, while the senior researchers planned high level approach and provided mentorship and review of materials throughout our execution.
Research Methods: Customer and SME interviews and survey to sellers
Background:
Data Fabric is an architectural approach with the end goal of simplifying data access and self-service data consumption while ensuring data is of high quality and secure. A company looking to enact a data fabric architecture has the ultimate goal of democratizing access to data to ensure data is available to the users that need it in a secure way. A data fabric architecture involves a coordinated set of tools and technologies. (Source)
IBM offers a variety of software tools to help companies enact a data fabric architecture. There is not one tool that facilitates a data fabric architecture, it rather depends on the individual needs of a company to apply the right combination of software to suit their situation. This may include any combination of:
Data Management, including the data governance and security of data.
Data Ingestion, connecting cloud data sources together.
Data Processing, refining relevant data.
Data Orchestration, transforming, integrating, and cleansing the data.
Data Discovery, finding opportunities to connect disparate sources of data.
Data Access, ensuring sensitive data has the right permissions and relevant data can be surfaced through dashboards and data visualization.
(Source)
The problem:
The GM of Design at IBM noticed a potential disconnect in how our company speaks to data fabric compared to how customers speak to the concept. Furthermore, sales in that area had potential to increase. The GM and VP of design saw these challenges and reached out to researchers on the Data and AI software research team. Based on past performance, I along with another user researcher, were chosen to spearhead user research in this area.
We were tasked with understanding how our company’s data fabric messaging and sales process could be improved. As a research team we considered methods and avenues of data available to us. Questions we considered at this point included:
What is the current sales process for winning Data Fabric customers?
Where do we gain vs. lose clients in our pitches and why?
How can we better empower our sales teams to be effective?
We came to the conclusion that to meet the goal proposed, we would need to approach the question through different avenues, namely:
The customer’s perspective:
Understanding our customer’s mental model and expectations of a “data fabric” architecture
Understanding what elements of our sales pitches resonate with customers and which don’t
The seller’s perspective:
Understanding from the seller perspective, what challenges they face as they pitch data fabric architectures in the field
Goals:
Identify software customer expectations around Data Fabric
Understand the buying process and roles involved
Identify the challenges in selling a Data Fabric in order to help empower sellers to sell Data Fabric
Research questions:
How do software customers define a data fabric?
What do software customers expect a data fabric will help them with?
What is the current data fabric buying process (roles involved, time spent, highs and lows)?
Where are there inefficiencies in this buying process?
Methods and Process:
As mentioned previously, we needed to:
Understand the current mental model and expectations of a “data fabric” from customers
Evaluate how our current sales pitches match/mismatch their mental models of a data fabric
Understand from the seller perspective, what challenges they face as they pitch data fabric architectures in the field
In order to do this we used two methods concurrently:
Software Customer and SME interviews - 1.5 hour sessions with current IBM customers and non-customers that have been involved in the evaluation of data fabric software solutions for their company.
Outline of the interview:
Setting context: their role at the company and experience choosing a data fabric software solution
Understanding their mental model and expectations: how they define a data fabric, what they looked for in data fabric solutions, what KPI’s are they reaching for at their company
Evaluating our sales pitch: Screen share of current data fabric sales decks and follow up questions on their thoughts
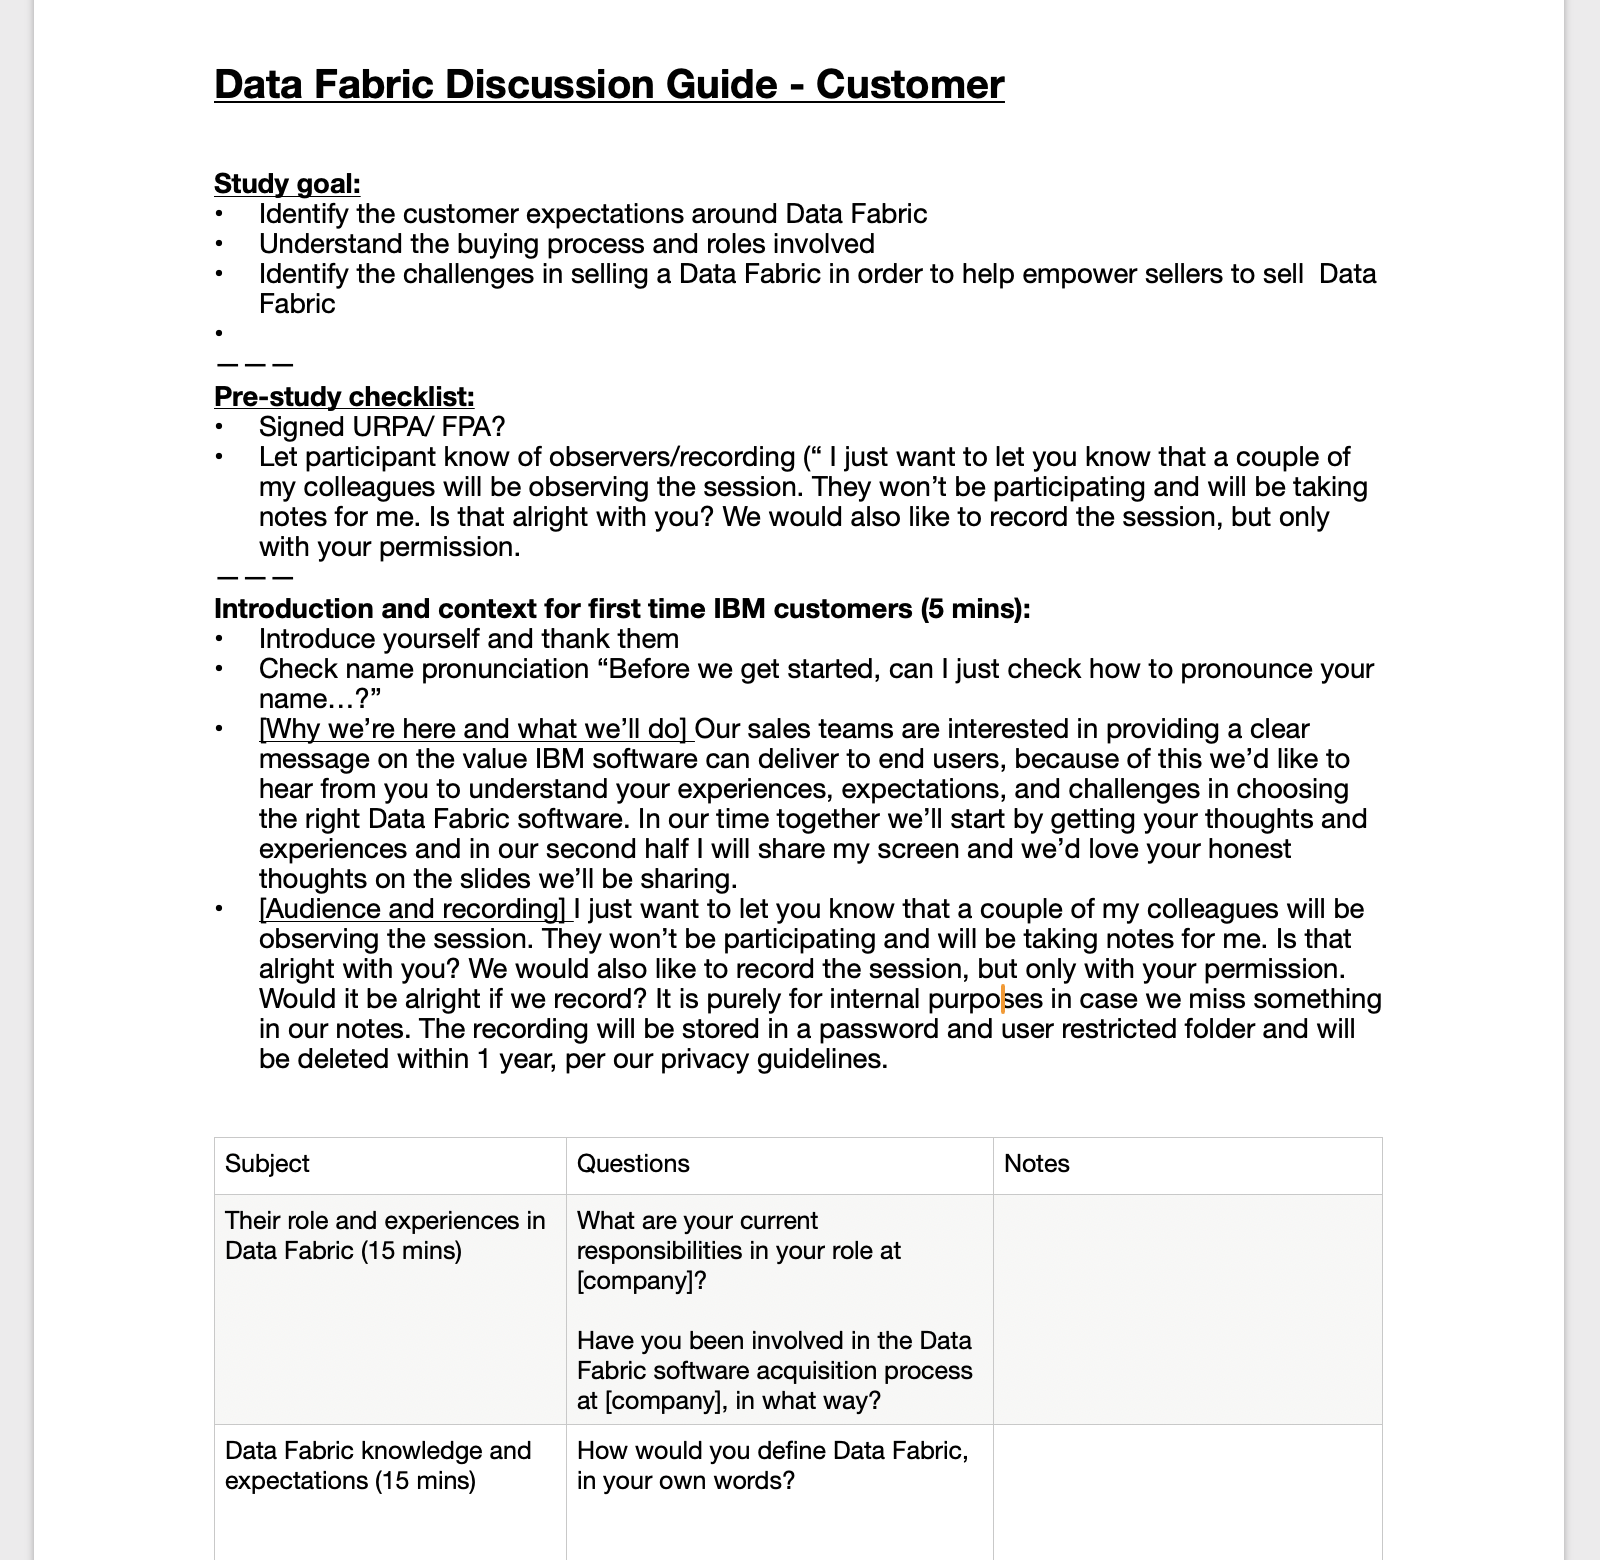
Example Discussion Guide
Pictured here is an example of the discussion guide that was used to lead the interview, including permission to record, context setting for the participant, and outline of question themes and flow.
Seller survey - launched a 20 minute anonymous survey to Data Fabric sellers across IBM
We collaborated with an in-house consulting team that was also focused on seller process enhancement goals, specific to our internal seller knowledge database, to launch a survey across all Data and AI software sellers at IBM. This allowed us to reach a wide audience of internal participants that we wouldn’t have been able to otherwise. In order to increase participation, we also negotiated a drawing for 5 participants to get Bluepoints, IBM’s internal reward points system.
The survey included:
Background on seller demographics (location, years in role, department) -Dropdown and multiple choice formats
Understanding of Data and AI and Data Fabric concepts - Multiple choice format questions and self assessments with Likert scales
Experience and challenges faced in selling software, including roles interfaced and time commitments - Multiple choice and open ended survey questions
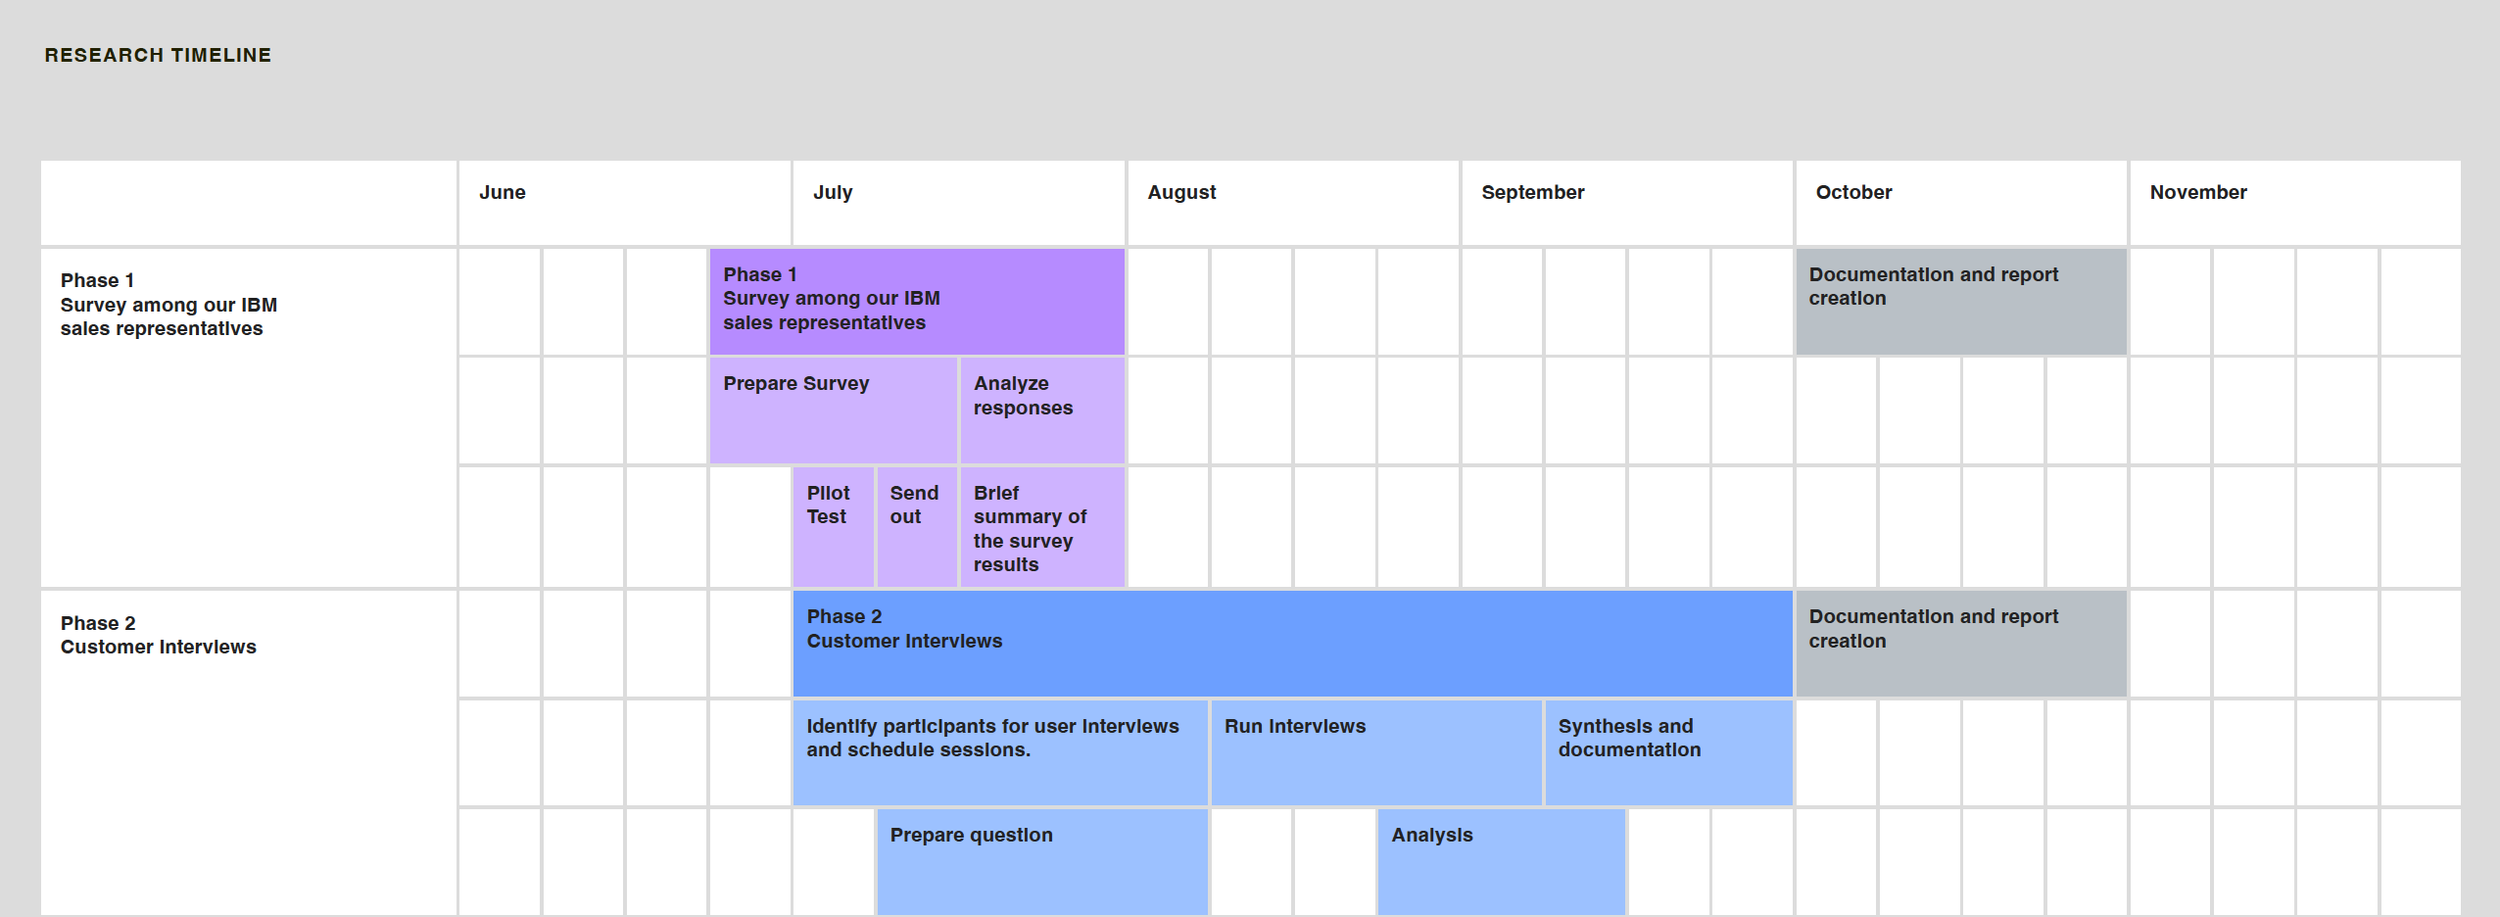
CHALLENGE: One of the challenges with this project, was that given its interest by executive leadership, we were on a tight timeline to deliver results. We made sure to deliver timely results through careful planning of our timeline along with other communications channels:

“A good strategy to have: overcommunicate.””
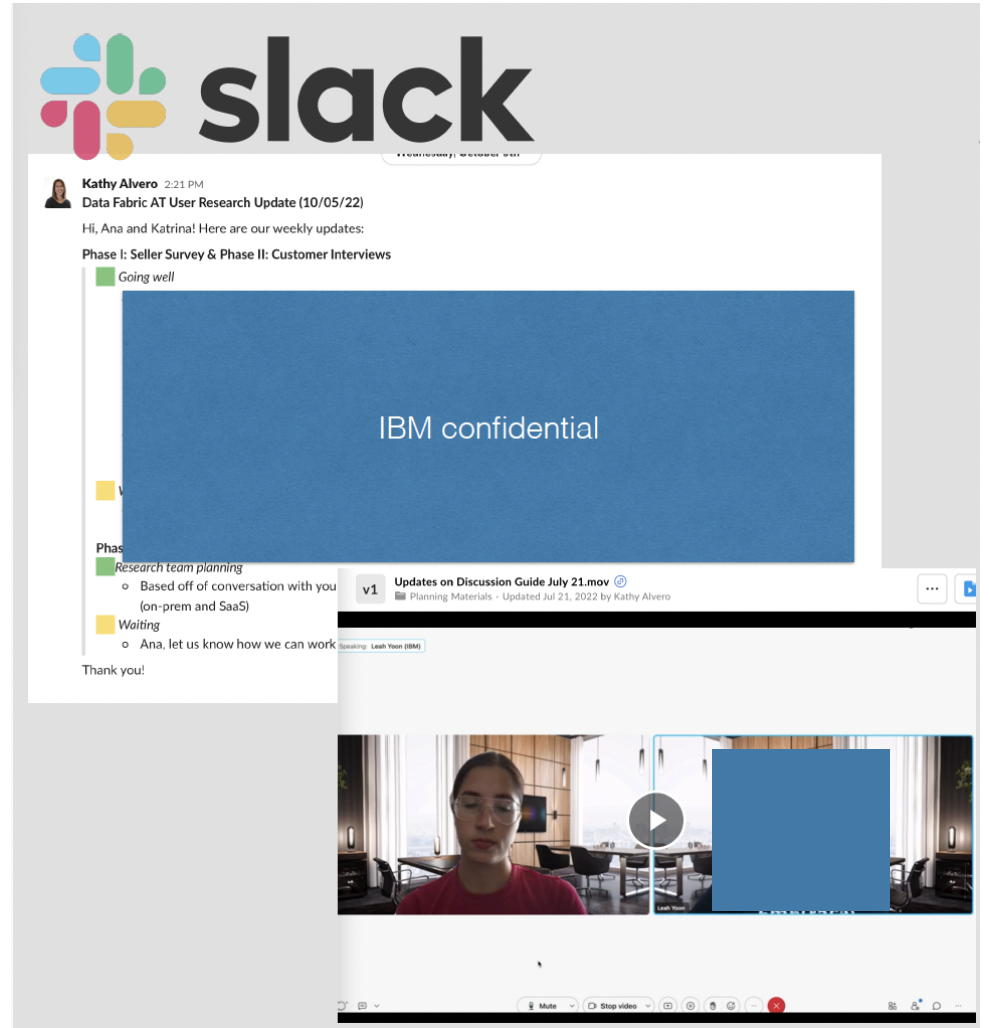
Through Slack, our company’s main online communication channel, we sent out quick updates. These included:
- after an interview we would share our raw notes along with a few highlights from the session
- at the end of all interviews we gave bullet point highlights. This was shared with the caveat that a full synthesis was underway and to not make final decisions on this preliminary data.
- every Wednesday we would give an overview of overall project status where we highlighted what went well, what items we were waiting on, and what specific asks we needed help with (example pictured left)
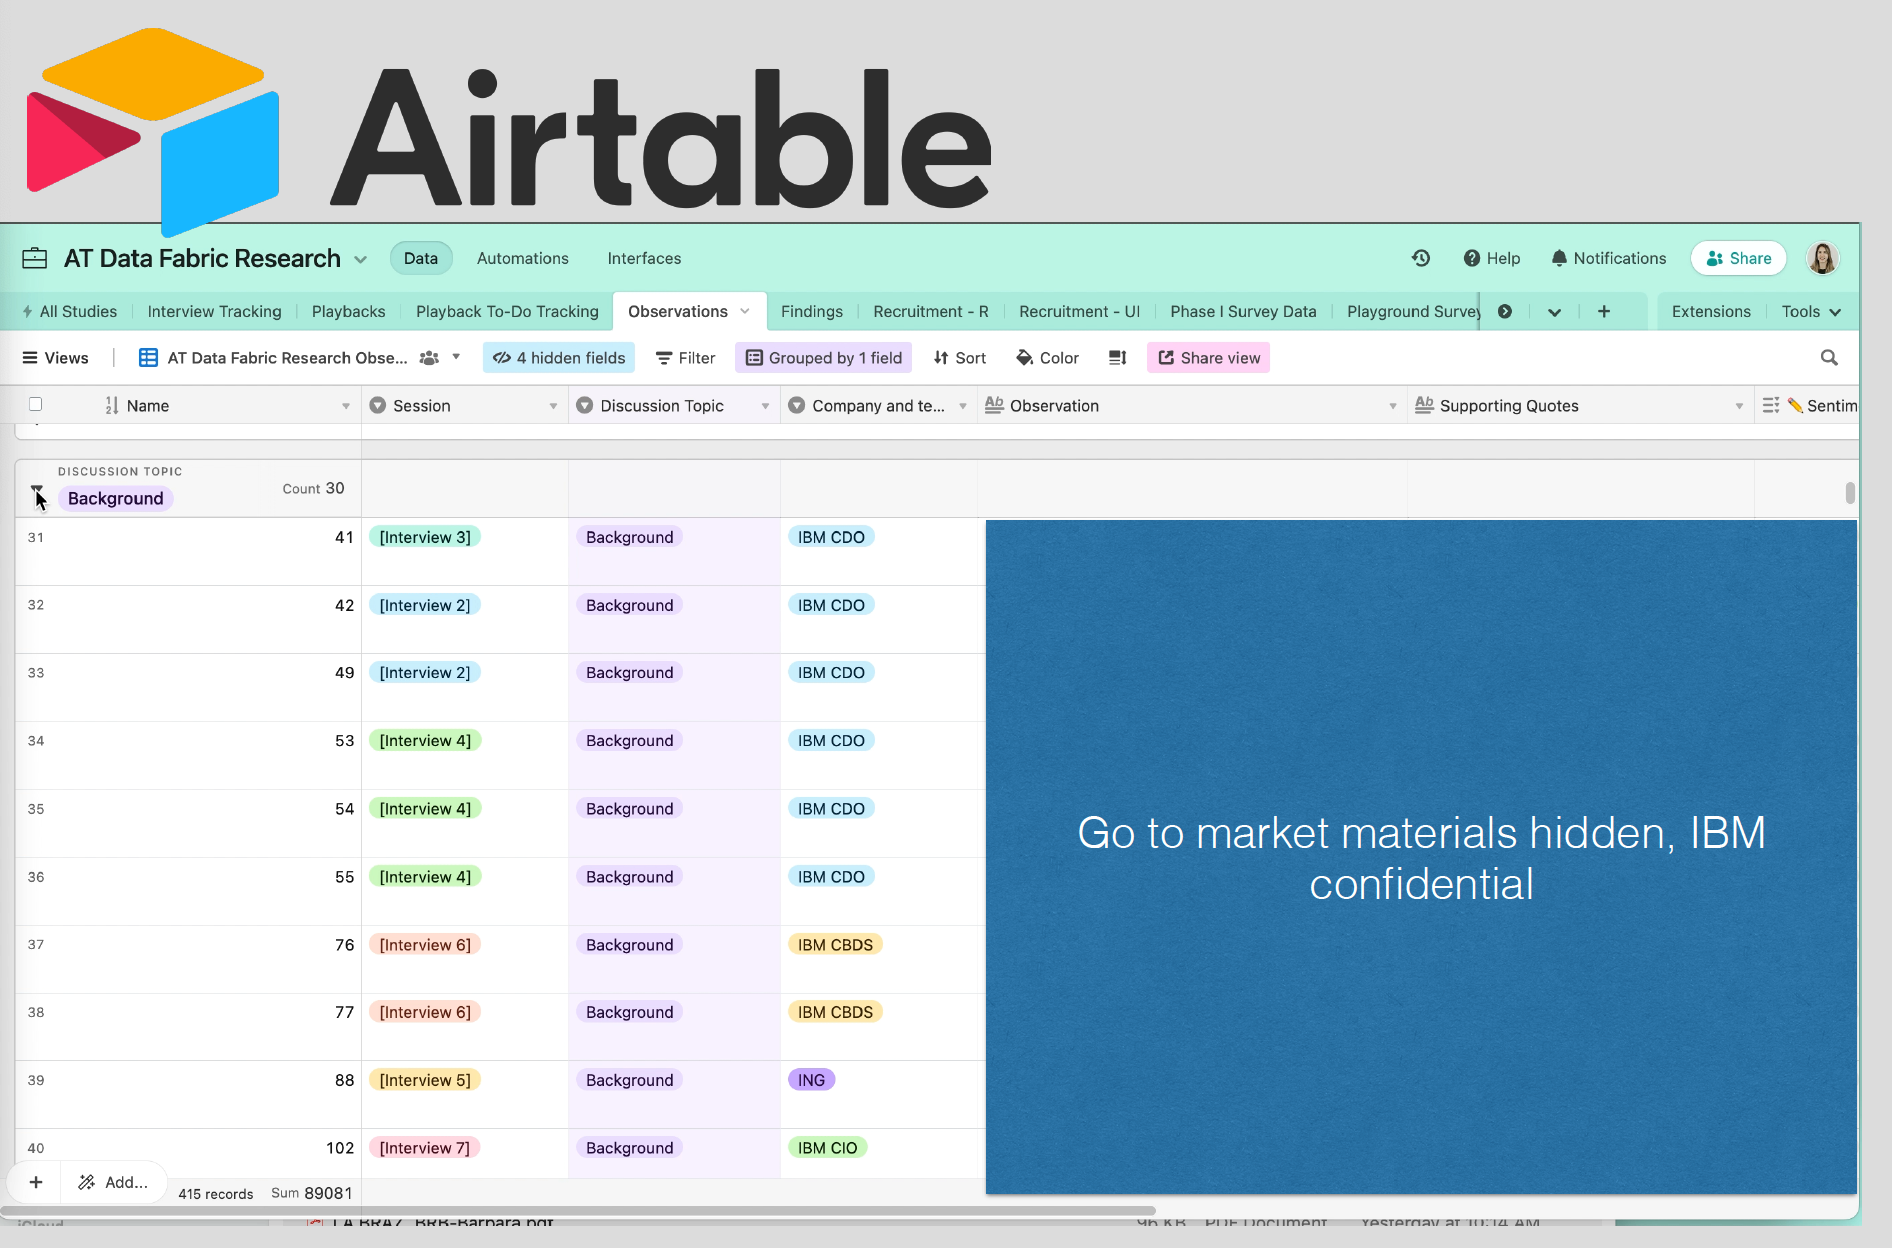
In order to help our results be accessible as-needed by stakeholders, we set up an Airtable database where interview and open-ended survey data was categorized by key themes. This Airtable base also included anonymized participant details, task tracking, and our schedule of upcoming playbacks.
Participants:
Software Customer interviews

We spoke to current IBM customers, non-IBM customers and internal SME’s for interviews. We chose to recruit both sets of participants so that our results would reflect larger market sentiment and not be skewed to IBM specific perspectives.
Non-customers had to have knowledge of data architecture approaches (either data fabric or data mesh) and be involved in data product buying processes.
Roles included:
Director of Data Stewardship
Data Governance Manager
Chief Architect
Senior Technical Program Manager
IBM Seller Survey

Our survey was launched across IBM to sellers of data fabric. In order to increase participation, we coordinated a random prize draw for 5 IBMers.
Analysis and Results

Analysis of interviews
Interview data was promptly uploaded and coded in our project’s Airtable base. Themes included:
Background (context of participant role)
Data fabric definitions
Data fabric impact expectations
Sales processes
Sales deck feedback
The uploaded transcript information included recording and timestamp information, which helped us quickly refer back to original audio and easily pull audio for presentations.
“Observations” corresponded to quotes and these observations were then grouped into higher level “Findings” which uncovered patterns and themes across interviews.
Survey Analysis
Survey data was downloaded from Alchemer and initially uploaded to Airtable for analysis and data visualization. The Airtable Interfaces feature was used to provide a dashboard of results.
We analyzed results and reported back findings, taking into consideration the question type and the best mode of presenting insights.
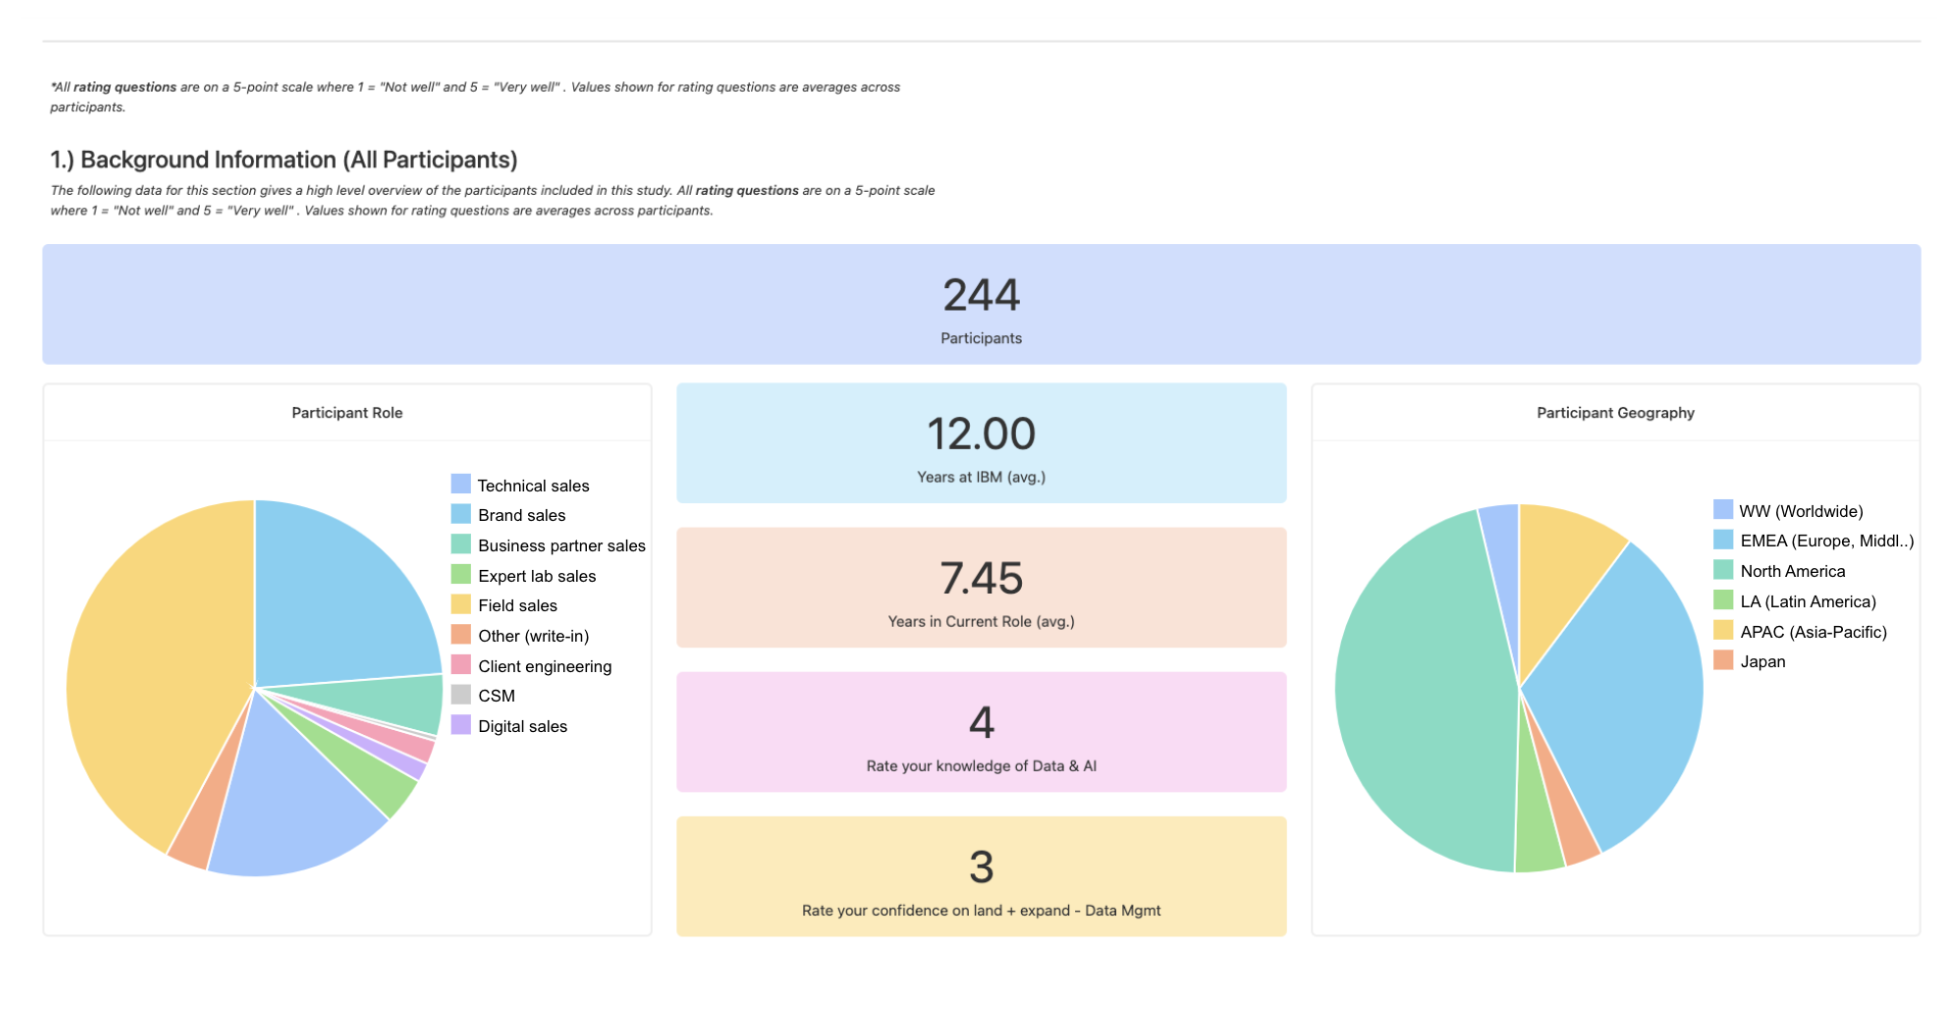
We ran into barriers to edit visualizations and moved our dashboard results over to IBM Cognos.
The largest challenge with analyzing survey data was going through the large number of open ended responses and ensuring we were being consistent in coding as I and the other user researcher on the project went through the data. We divided the coding of responses and in order to ensure inter-coder reliability we both coded a small subset of the data and compared results, building a codebook to establish a set of consistent code definitions on the set of data.

Pictured is the IBM Cognos dashboard of results we created. IBM sensitive information has been hidden.
Using Cognos instead of Airtable gave us more flexibility in the range of visualizations available to us and the edits to visualizations we could do.
Frequently used visualization methods included bar graphs (to compare frequency of different categories), pie charts (to show percentages of a whole), along with filterable raw quotes that corresponded to our coded themes.
Results across these 2 methods were analyzed and we formed high level themes to easily communicate findings to our stakeholders with qualitative interview data and quantitative data points highlighted throughout the presentation.
Analysis of the interviews and seller survey uncovered 4 key themes:
Theme 1 - We learned that participants define Data Fabric in the same way that IBM communicates on it, but disconnect arises from a lack of clear communication of value for Data Fabric and what it can do. This sentiment was echoed by our sellers, with one noting “I would have tried to take the conversation off of the solution itself and more to the capabilities.”
Theme 2 - With theme 2 we shared details on what the buying process for a Data Fabric software architecture looks like and what potential customers look for when evaluating solutions. When a company is making a purchase decision, the evaluators need to see material that resonates with the specific problems their expert teams are trying to solve along with the higher level business goals that those in the C-suite have.
Theme 3- This theme was around the level of detail customers expect when getting a pitch. Participants wanted to see specifics about how Data Fabric will help their teams solve their problems and our marketing materials should target specific user needs without jargon.
Theme 4- We heard from a majority of the people we talked to that the metrics shared in our go to market materials lacked context that may otherwise help communicate true value. For example, a cost saving metric shared lacked detail on time context or how it was calculated.
These themes were communicated along with recommendations on how they could be addressed.
Outcomes
The results of our research were shared with GM of Design along with other IBM executives, including the Director of GTM Product Management, VP of Product Management, and Director of Sales and Marketing. Following the playback of our research, the GTM team began changes on the Data Fabric sales decks being used to pitch the architecture. In addition to changes on the material itself, there were also changes to the internal sales material website. These changes contributed to a 4% increase in sales the following year.
Lastly, in order for our research results to be easily found and stay relevant, we built a website and data dashboard to showcase our results and recommendations.

Reflections
With this project I learned how to effectively manage and collaborate with executive stakeholders. With challenges such as their limited schedule, competing attention grabbers, and a need for “results yesterday”, organization and “overcommunication” was key along with leveraging different modes of communication such as:
Slack
video updates
standing website, dashboard, and repository of study results and information
Had I been able to continue work in this space I would have loved to test a new iteration of the GTM materials in a subsequent interview with the same participants so that we could compare these.